|
Download Data (XLS File) |
|
||||||||
|
||||||||
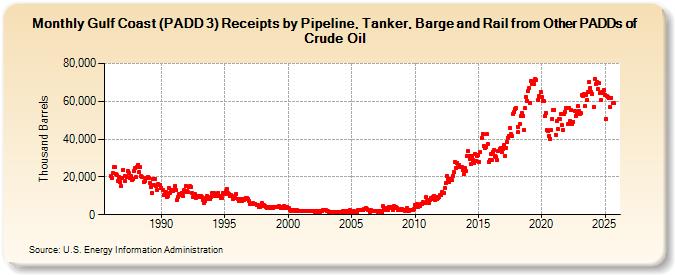
| Gulf Coast (PADD 3) Receipts by Pipeline, Tanker, Barge and Rail from Other PADDs of Crude Oil (Thousand Barrels) | ||||||||
| Year | Jan | Feb | Mar | Apr | May | Jun | Jul | Aug | Sep | Oct | Nov | Dec |
|---|---|---|---|---|---|---|---|---|---|---|---|---|
| 1986 | 20,442 | 19,309 | 22,051 | 25,033 | 25,297 | 21,509 | 20,772 | 17,867 | 19,702 | 17,567 | 14,980 | 19,535 |
| 1987 | 23,734 | 18,043 | 20,727 | 19,778 | 23,067 | 22,219 | 19,596 | 20,627 | 18,140 | 18,996 | 23,180 | 24,487 |
| 1988 | 19,747 | 25,487 | 26,436 | 22,450 | 25,145 | 20,368 | 19,774 | 17,467 | 17,666 | 19,200 | 19,316 | 20,182 |
| 1989 | 19,382 | 16,975 | 14,757 | 11,600 | 18,867 | 15,648 | 18,906 | 14,954 | 13,245 | 16,077 | 15,737 | 15,753 |
| 1990 | 14,396 | 13,019 | 10,310 | 10,826 | 12,265 | 9,364 | 10,149 | 14,008 | 11,694 | 12,917 | 12,767 | 12,661 |
| 1991 | 13,221 | 15,274 | 12,900 | 8,018 | 9,624 | 10,931 | 10,368 | 11,732 | 10,057 | 12,983 | 12,101 | 15,261 |
| 1992 | 12,366 | 12,052 | 14,398 | 14,987 | 14,545 | 11,279 | 9,183 | 9,631 | 10,734 | 9,035 | 9,908 | 9,687 |
| 1993 | 9,338 | 9,778 | 9,168 | 8,009 | 6,418 | 7,171 | 8,676 | 9,975 | 8,412 | 8,798 | 8,360 | 9,267 |
| 1994 | 11,318 | 11,681 | 11,351 | 10,111 | 9,775 | 9,675 | 11,506 | 9,975 | 9,001 | 8,626 | 11,584 | 11,155 |
| 1995 | 11,170 | 12,336 | 13,625 | 11,235 | 11,112 | 9,929 | 10,238 | 9,826 | 8,526 | 8,895 | 8,980 | 11,048 |
| 1996 | 8,459 | 7,187 | 8,157 | 7,547 | 7,314 | 8,173 | 7,554 | 8,457 | 9,026 | 8,849 | 8,289 | 7,088 |
| 1997 | 5,906 | 5,412 | 5,674 | 6,155 | 5,628 | 5,841 | 5,212 | 4,891 | 3,918 | 4,268 | 4,371 | 6,094 |
| 1998 | 4,515 | 4,880 | 4,728 | 4,251 | 3,531 | 4,177 | 4,096 | 3,592 | 3,504 | 4,204 | 3,780 | 4,088 |
| 1999 | 3,941 | 3,840 | 4,169 | 4,445 | 3,855 | 3,707 | 3,795 | 4,078 | 4,502 | 3,578 | 3,411 | 4,095 |
| 2000 | 3,622 | 3,359 | 2,361 | 1,995 | 2,249 | 2,424 | 2,225 | 2,211 | 2,235 | 2,120 | 1,908 | 2,172 |
| 2001 | 2,022 | 1,851 | 2,171 | 1,986 | 1,986 | 2,046 | 1,910 | 2,029 | 2,153 | 2,141 | 1,994 | 1,979 |
| 2002 | 1,848 | 1,606 | 1,849 | 1,663 | 1,896 | 1,747 | 1,537 | 2,127 | 1,944 | 2,362 | 2,267 | 2,468 |
| 2003 | 2,243 | 1,852 | 1,769 | 1,396 | 1,513 | 1,580 | 1,592 | 1,533 | 1,602 | 1,591 | 1,566 | 1,571 |
| 2004 | 1,531 | 1,604 | 1,427 | 1,410 | 1,968 | 1,753 | 1,325 | 1,902 | 1,470 | 1,947 | 2,276 | 1,522 |
| 2005 | 693 | 781 | 1,923 | 938 | 1,009 | 900 | 2,296 | 2,600 | 2,604 | 2,608 | 2,612 | 2,471 |
| 2006 | 3,098 | 2,935 | 3,422 | 2,833 | 2,446 | 1,679 | 2,752 | 2,062 | 2,004 | 1,970 | 1,743 | 2,141 |
| 2007 | 2,182 | 1,494 | 1,958 | 1,172 | 1,839 | 1,356 | 4,466 | 3,343 | 2,272 | 3,397 | 2,624 | 3,966 |
| 2008 | 3,733 | 3,505 | 4,284 | 2,606 | 4,513 | 3,779 | 3,984 | 3,580 | 2,757 | 2,722 | 2,513 | 2,781 |
| 2009 | 3,135 | 2,323 | 2,348 | 2,107 | 3,469 | 2,129 | 2,205 | 2,336 | 2,738 | 2,470 | 2,694 | 2,876 |
| 2010 | 5,186 | 4,039 | 5,700 | 4,183 | 4,791 | 4,754 | 5,563 | 5,434 | 6,582 | 6,373 | 9,218 | 7,234 |
| 2011 | 7,616 | 6,198 | 7,763 | 9,043 | 8,543 | 9,614 | 10,158 | 7,539 | 9,410 | 8,328 | 8,737 | 9,229 |
| 2012 | 10,255 | 10,294 | 11,923 | 11,403 | 13,997 | 16,817 | 20,555 | 18,566 | 17,145 | 18,785 | 18,339 | 18,192 |
| 2013 | 20,698 | 22,403 | 27,897 | 24,707 | 27,536 | 25,254 | 26,278 | 25,114 | 25,438 | 23,615 | 21,308 | 24,899 |
| 2014 | 22,962 | 31,000 | 33,506 | 30,993 | 29,471 | 26,716 | 30,955 | 28,727 | 27,115 | 32,359 | 28,475 | 31,006 |
| 2015 | 31,415 | 28,076 | 33,125 | 40,678 | 42,639 | 36,366 | 35,510 | 35,817 | 42,447 | 37,269 | 27,986 | 28,963 |
| 2016 | 32,306 | 28,708 | 33,176 | 34,426 | 31,270 | 30,656 | 28,747 | 33,907 | 34,926 | 35,304 | 33,033 | 34,921 |
| 2017 | 36,817 | 31,178 | 35,461 | 38,294 | 40,750 | 41,702 | 45,882 | 42,523 | 41,627 | 53,529 | 54,093 | 55,787 |
| 2018 | 56,532 | 46,622 | 43,619 | 47,964 | 52,026 | 53,912 | 52,476 | 44,815 | 56,431 | 62,530 | 60,379 | 65,245 |
| 2019 | 66,784 | 59,246 | 70,944 | 69,386 | 70,130 | 69,387 | 71,793 | 71,133 | 60,629 | 62,578 | 62,147 | 65,041 |
| 2020 | 62,317 | 60,401 | 60,038 | 51,997 | 53,985 | 45,071 | 44,278 | 41,794 | 40,229 | 44,690 | 50,575 | 55,536 |
| 2021 | 55,289 | 42,395 | 49,549 | 45,315 | 50,689 | 50,877 | 53,295 | 47,305 | 44,934 | 53,111 | 54,565 | 56,517 |
| 2022 | 56,688 | 48,240 | 56,584 | 49,411 | 55,286 | 47,787 | 49,082 | 54,918 | 52,452 | 53,928 | 57,352 | 54,963 |
| 2023 | 53,154 | 53,668 | 63,535 | 62,579 | 63,699 | 57,363 | 63,219 | 60,553 | 64,756 | 70,332 | 67,252 | 65,064 |
| 2024 | 63,486 | |||||||||||
| - = No Data Reported; -- = Not Applicable; NA = Not Available; W = Withheld to avoid disclosure of individual company data. |
| Release Date: 3/29/2024 |
| Next Release Date: 4/30/2024 |