|
Download Data (XLS File) |
|
||||||||
|
||||||||
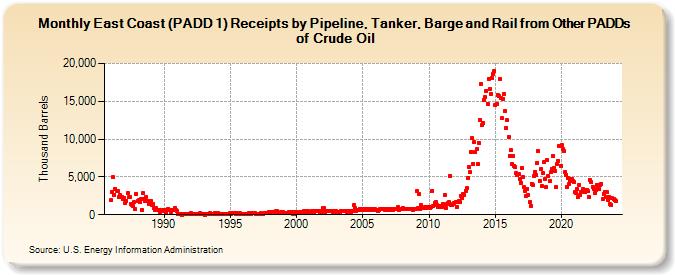
| East Coast (PADD 1) Receipts by Pipeline, Tanker, Barge and Rail from Other PADDs of Crude Oil (Thousand Barrels) | ||||||||
| Year | Jan | Feb | Mar | Apr | May | Jun | Jul | Aug | Sep | Oct | Nov | Dec |
|---|---|---|---|---|---|---|---|---|---|---|---|---|
| 1986 | 1,913 | 3,046 | 4,935 | 2,658 | 3,371 | 3,184 | 3,201 | 2,329 | 2,628 | 2,365 | 2,394 | 2,081 |
| 1987 | 2,256 | 1,538 | 1,868 | 2,863 | 2,283 | 2,391 | 1,435 | 1,323 | 1,195 | 1,664 | 739 | 2,729 |
| 1988 | 1,846 | 1,890 | 1,745 | 2,060 | 658 | 2,822 | 2,050 | 1,803 | 2,366 | 1,849 | 1,433 | 1,522 |
| 1989 | 1,866 | 1,273 | 1,447 | 905 | 682 | 828 | 613 | 621 | 407 | 523 | 613 | 481 |
| 1990 | 573 | 587 | 309 | 561 | 774 | 638 | 388 | 638 | 641 | 628 | 924 | 621 |
| 1991 | 516 | 96 | 134 | 154 | 22 | 87 | 137 | 96 | 80 | 118 | 91 | 104 |
| 1992 | 161 | 120 | 105 | 112 | 85 | 95 | 100 | 91 | 115 | 169 | 88 | 154 |
| 1993 | 117 | 0 | 147 | 75 | 71 | 96 | 176 | 125 | 151 | 146 | 168 | 108 |
| 1994 | 171 | 173 | 148 | 76 | 91 | 150 | 130 | 147 | 97 | 151 | 145 | 147 |
| 1995 | 190 | 146 | 169 | 182 | 214 | 127 | 168 | 125 | 125 | 190 | 127 | 107 |
| 1996 | 64 | 151 | 129 | 107 | 106 | 187 | 50 | 105 | 166 | 208 | 166 | 148 |
| 1997 | 149 | 107 | 150 | 148 | 191 | 148 | 113 | 260 | 283 | 193 | 186 | 375 |
| 1998 | 344 | 274 | 302 | 296 | 216 | 448 | 470 | 203 | 218 | 251 | 372 | 253 |
| 1999 | 368 | 239 | 267 | 230 | 270 | 298 | 294 | 247 | 297 | 127 | 118 | 301 |
| 2000 | 378 | 313 | 379 | 308 | 331 | 344 | 401 | 482 | 337 | 437 | 433 | 411 |
| 2001 | 423 | 393 | 438 | 362 | 281 | 435 | 475 | 539 | 429 | 395 | 373 | 455 |
| 2002 | 898 | 858 | 394 | 482 | 440 | 500 | 505 | 484 | 520 | 372 | 461 | 409 |
| 2003 | 441 | 388 | 408 | 321 | 469 | 500 | 485 | 429 | 456 | 470 | 352 | 526 |
| 2004 | 494 | 383 | 527 | 504 | 1,219 | 953 | 464 | 670 | 560 | 779 | 657 | 709 |
| 2005 | 618 | 697 | 800 | 636 | 710 | 612 | 700 | 765 | 678 | 755 | 700 | 706 |
| 2006 | 663 | 596 | 520 | 593 | 735 | 780 | 788 | 802 | 676 | 757 | 672 | 742 |
| 2007 | 738 | 663 | 790 | 620 | 694 | 737 | 797 | 738 | 982 | 673 | 734 | 806 |
| 2008 | 862 | 727 | 808 | 741 | 694 | 775 | 745 | 760 | 718 | 669 | 690 | 764 |
| 2009 | 707 | 3,159 | 894 | 2,736 | 787 | 1,226 | 824 | 824 | 1,010 | 936 | 965 | 1,020 |
| 2010 | 1,052 | 901 | 1,032 | 3,179 | 1,206 | 1,486 | 1,685 | 1,266 | 1,082 | 1,186 | 1,083 | 1,122 |
| 2011 | 1,078 | 1,453 | 2,665 | 948 | 1,365 | 1,507 | 1,626 | 5,171 | 1,314 | 1,280 | 1,456 | 1,583 |
| 2012 | 1,676 | 1,071 | 1,678 | 1,809 | 1,639 | 2,506 | 2,156 | 2,751 | 2,633 | 3,181 | 3,471 | 4,870 |
| 2013 | 6,324 | 5,609 | 8,351 | 10,084 | 6,712 | 9,585 | 8,297 | 8,635 | 6,652 | 9,499 | 12,531 | 17,279 |
| 2014 | 11,870 | 12,188 | 15,187 | 15,512 | 16,421 | 14,707 | 17,975 | 16,566 | 16,028 | 18,118 | 18,668 | 18,993 |
| 2015 | 14,490 | 14,678 | 15,886 | 15,640 | 17,897 | 15,391 | 12,812 | 15,361 | 15,976 | 13,729 | 11,518 | 12,472 |
| 2016 | 10,288 | 7,805 | 8,493 | 6,705 | 7,755 | 6,444 | 6,337 | 5,482 | 5,200 | 5,346 | 4,698 | 4,251 |
| 2017 | 6,243 | 4,984 | 3,639 | 3,188 | 2,513 | 3,430 | 2,590 | 1,677 | 1,195 | 4,103 | 3,867 | 5,175 |
| 2018 | 5,670 | 5,219 | 6,871 | 8,405 | 4,504 | 6,045 | 3,832 | 5,466 | 6,949 | 4,751 | 3,653 | 7,197 |
| 2019 | 5,135 | 4,409 | 5,602 | 6,077 | 7,807 | 6,229 | 5,839 | 3,635 | 6,659 | 7,111 | 9,041 | 6,484 |
| 2020 | 9,221 | 8,670 | 8,463 | 5,585 | 5,300 | 3,721 | 4,811 | 4,024 | 4,402 | 4,767 | 4,494 | 4,337 |
| 2021 | 2,976 | 2,883 | 3,382 | 2,284 | 3,955 | 2,665 | 3,004 | 3,383 | 3,158 | 2,971 | 3,262 | 3,243 |
| 2022 | 3,080 | 2,395 | 4,549 | 4,300 | 3,680 | 3,356 | 2,871 | 3,226 | 3,928 | 3,705 | 3,454 | 3,925 |
| 2023 | 4,116 | 2,095 | 2,781 | 2,972 | 2,379 | 2,990 | 1,995 | 2,345 | 1,402 | 1,250 | 2,226 | 2,142 |
| 2024 | 2,106 | |||||||||||
| - = No Data Reported; -- = Not Applicable; NA = Not Available; W = Withheld to avoid disclosure of individual company data. |
| Release Date: 3/29/2024 |
| Next Release Date: 4/30/2024 |