|
Download Data (XLS File) |
|
||||||||
|
||||||||
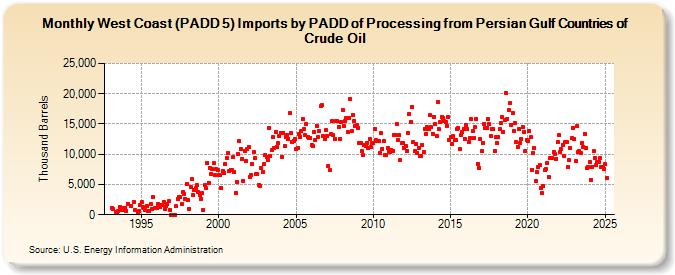
| West Coast (PADD 5) Imports by PADD of Processing from Persian Gulf Countries of Crude Oil (Thousand Barrels) | ||||||||
| Year | Jan | Feb | Mar | Apr | May | Jun | Jul | Aug | Sep | Oct | Nov | Dec |
|---|---|---|---|---|---|---|---|---|---|---|---|---|
| 1993 | 1,104 | 1,018 | 513 | 505 | 586 | 1,288 | 1,097 | 703 | 1,089 | 1,069 | ||
| 1994 | 676 | 1,853 | 1,464 | 2,109 | 705 | 343 | 571 | 1,595 | ||||
| 1995 | 2,056 | 1,255 | 1,106 | 700 | 1,413 | 575 | 567 | 1,838 | 989 | 2,853 | 1,085 | 1,098 |
| 1996 | 1,107 | 1,735 | 1,230 | 1,639 | 1,601 | 2,178 | 951 | 1,387 | 1,729 | 2,191 | 782 | 0 |
| 1997 | 0 | 0 | 0 | 1,378 | 2,629 | 2,941 | 2,886 | 1,806 | 3,731 | 3,482 | 2,628 | 5,068 |
| 1998 | 2,409 | 961 | 4,627 | 5,864 | 3,287 | 4,017 | 4,378 | 4,910 | 3,733 | 3,267 | 2,548 | 3,508 |
| 1999 | 802 | 4,856 | 4,335 | 8,623 | 5,285 | 7,797 | 6,788 | 7,520 | 8,477 | 6,549 | 7,493 | 7,426 |
| 2000 | 6,497 | 6,567 | 4,451 | 7,231 | 6,933 | 8,324 | 9,314 | 10,206 | 7,210 | 7,444 | 7,320 | 9,496 |
| 2001 | 7,095 | 3,644 | 5,343 | 9,997 | 12,111 | 10,898 | 9,259 | 5,606 | 10,587 | 8,893 | 10,928 | 11,197 |
| 2002 | 6,315 | 6,634 | 8,405 | 10,439 | 9,345 | 6,686 | 6,672 | 4,960 | 4,759 | 7,723 | 7,107 | 8,376 |
| 2003 | 9,834 | 9,531 | 9,125 | 14,314 | 9,735 | 10,636 | 12,788 | 11,106 | 13,681 | 11,273 | 11,793 | 12,968 |
| 2004 | 13,572 | 9,590 | 13,553 | 11,400 | 12,888 | 13,179 | 12,527 | 16,803 | 13,525 | 12,000 | 12,263 | 12,552 |
| 2005 | 10,874 | 11,079 | 13,313 | 12,923 | 13,906 | 15,851 | 14,121 | 13,105 | 15,049 | 12,834 | 12,742 | 12,724 |
| 2006 | 11,595 | 11,293 | 13,696 | 12,415 | 14,726 | 12,858 | 13,838 | 17,929 | 18,106 | 13,059 | 12,517 | 13,940 |
| 2007 | 12,994 | 8,071 | 7,366 | 13,312 | 15,517 | 13,095 | 12,496 | 15,515 | 15,442 | 14,577 | 12,459 | 15,336 |
| 2008 | 17,278 | 14,646 | 15,475 | 15,939 | 13,750 | 15,950 | 19,207 | 13,790 | 16,472 | 15,537 | 14,674 | 14,779 |
| 2009 | 14,343 | 11,910 | 11,817 | 10,462 | 9,793 | 11,501 | 11,422 | 11,899 | 11,019 | 12,508 | 11,207 | 11,835 |
| 2010 | 11,931 | 14,223 | 12,337 | 12,149 | 12,259 | 10,256 | 13,469 | 10,885 | 12,214 | 9,880 | 9,946 | 11,029 |
| 2011 | 10,583 | 10,428 | 10,739 | 10,456 | 13,122 | 13,253 | 14,979 | 12,397 | 13,123 | 9,066 | 11,784 | 11,829 |
| 2012 | 11,078 | 11,369 | 10,611 | 13,564 | 16,669 | 15,402 | 17,876 | 11,960 | 10,485 | 11,727 | 10,184 | 11,033 |
| 2013 | 9,625 | 9,666 | 11,565 | 10,345 | 14,230 | 13,361 | 14,442 | 14,250 | 16,435 | 14,465 | 13,384 | 16,197 |
| 2014 | 15,021 | 13,035 | 18,601 | 14,102 | 15,257 | 16,197 | 15,984 | 15,518 | 15,369 | 14,726 | 16,116 | 12,415 |
| 2015 | 12,816 | 11,690 | 12,961 | 12,319 | 12,281 | 14,104 | 14,370 | 10,902 | 13,183 | 13,626 | 14,217 | 12,562 |
| 2016 | 14,796 | 14,199 | 11,992 | 12,749 | 15,758 | 13,821 | 12,644 | 14,450 | 15,785 | 8,403 | 7,729 | 12,522 |
| 2017 | 10,507 | 11,872 | 15,019 | 14,352 | 14,295 | 15,748 | 14,978 | 13,044 | 14,250 | 14,199 | 10,557 | 12,812 |
| 2018 | 11,841 | 12,797 | 14,152 | 15,186 | 16,074 | 13,714 | 15,709 | 20,114 | 15,879 | 17,377 | 18,440 | 14,887 |
| 2019 | 16,831 | 13,810 | 15,219 | 11,991 | 11,213 | 14,229 | 11,876 | 12,558 | 14,509 | 13,655 | 10,553 | 12,357 |
| 2020 | 12,177 | 13,877 | 12,775 | 7,433 | 10,121 | 11,010 | 5,557 | 7,002 | 7,818 | 8,181 | 4,376 | 3,555 |
| 2021 | 4,701 | 7,335 | 7,518 | 8,614 | 6,246 | 9,416 | 9,450 | 9,335 | 10,411 | 9,980 | 9,283 | 11,981 |
| 2022 | 13,174 | 10,288 | 10,845 | 11,567 | 9,669 | 12,025 | 11,955 | 7,881 | 9,001 | 11,071 | 12,615 | 14,327 |
| 2023 | 12,509 | 8,896 | 14,612 | 10,324 | 10,516 | 10,260 | 11,872 | 11,255 | 13,412 | 11,010 | 7,677 | 7,854 |
| 2024 | 8,741 | |||||||||||
| - = No Data Reported; -- = Not Applicable; NA = Not Available; W = Withheld to avoid disclosure of individual company data. |
| Release Date: 3/29/2024 |
| Next Release Date: 4/30/2024 |