|
Download Data (XLS File) |
|
||||||||
|
||||||||
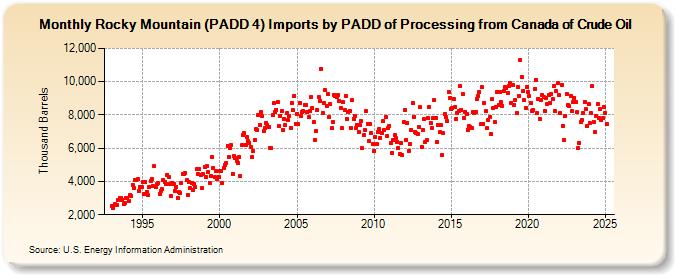
| Rocky Mountain (PADD 4) Imports by PADD of Processing from Canada of Crude Oil (Thousand Barrels) | ||||||||
| Year | Jan | Feb | Mar | Apr | May | Jun | Jul | Aug | Sep | Oct | Nov | Dec |
|---|---|---|---|---|---|---|---|---|---|---|---|---|
| 1993 | 2,550 | 2,385 | 2,649 | 2,587 | 2,606 | 2,894 | 3,026 | 2,992 | 2,909 | 2,629 | 2,734 | 2,980 |
| 1994 | 3,026 | 2,853 | 3,178 | 3,102 | 3,814 | 3,616 | 4,062 | 4,106 | 4,140 | 3,413 | 3,680 | 3,667 |
| 1995 | 3,992 | 3,229 | 3,971 | 3,375 | 3,157 | 3,671 | 4,039 | 4,151 | 3,709 | 4,910 | 3,640 | 3,839 |
| 1996 | 3,886 | 3,250 | 3,416 | 3,528 | 4,111 | 3,976 | 3,843 | 4,407 | 4,287 | 3,844 | 3,106 | 3,917 |
| 1997 | 3,859 | 3,442 | 3,669 | 3,023 | 3,372 | 3,296 | 3,929 | 4,431 | 4,463 | 4,508 | 4,086 | 3,205 |
| 1998 | 3,980 | 3,595 | 3,926 | 3,510 | 3,874 | 3,677 | 4,719 | 4,429 | 4,752 | 4,380 | 3,620 | 4,432 |
| 1999 | 4,863 | 4,263 | 4,925 | 4,589 | 3,931 | 4,316 | 5,459 | 4,828 | 4,246 | 4,648 | 4,163 | 4,272 |
| 2000 | 4,638 | 4,651 | 3,893 | 4,779 | 5,001 | 5,124 | 6,133 | 5,495 | 6,026 | 6,169 | 4,465 | 5,546 |
| 2001 | 5,432 | 5,244 | 5,117 | 5,469 | 4,320 | 6,164 | 6,795 | 6,890 | 6,219 | 6,647 | 6,415 | 6,314 |
| 2002 | 6,064 | 5,488 | 5,810 | 6,506 | 7,132 | 7,091 | 7,968 | 7,398 | 8,166 | 7,911 | 7,007 | 7,191 |
| 2003 | 7,522 | 7,367 | 7,255 | 6,021 | 6,002 | 7,970 | 8,690 | 8,199 | 8,314 | 8,769 | 7,350 | 7,947 |
| 2004 | 8,235 | 7,106 | 7,782 | 7,388 | 8,108 | 7,672 | 7,964 | 7,220 | 8,707 | 8,280 | 9,147 | 7,472 |
| 2005 | 8,079 | 7,428 | 8,692 | 7,917 | 8,156 | 8,227 | 8,604 | 8,620 | 8,179 | 7,858 | 8,222 | 9,085 |
| 2006 | 8,391 | 7,597 | 6,499 | 7,039 | 8,304 | 9,060 | 8,863 | 10,756 | 8,139 | 8,702 | 9,476 | 8,564 |
| 2007 | 9,254 | 7,868 | 8,640 | 7,211 | 7,588 | 9,207 | 9,160 | 9,067 | 9,194 | 8,807 | 8,441 | 7,184 |
| 2008 | 8,762 | 8,298 | 9,162 | 7,762 | 8,170 | 8,244 | 7,228 | 8,867 | 7,782 | 7,929 | 7,190 | 7,384 |
| 2009 | 6,961 | 7,374 | 7,615 | 6,002 | 6,791 | 7,073 | 8,215 | 7,478 | 6,407 | 7,478 | 6,930 | 6,233 |
| 2010 | 5,853 | 6,672 | 6,253 | 6,959 | 7,156 | 6,626 | 6,925 | 7,617 | 7,095 | 7,874 | 6,706 | 7,236 |
| 2011 | 7,337 | 6,322 | 5,730 | 6,493 | 6,764 | 6,615 | 6,375 | 6,025 | 5,642 | 6,299 | 5,561 | 7,585 |
| 2012 | 8,286 | 6,514 | 7,506 | 5,835 | 6,262 | 7,123 | 8,720 | 7,896 | 6,969 | 6,905 | 6,851 | 7,299 |
| 2013 | 8,456 | 6,066 | 7,097 | 7,738 | 6,390 | 6,488 | 7,827 | 8,504 | 7,535 | 7,220 | 7,794 | 8,894 |
| 2014 | 7,841 | 6,399 | 7,378 | 6,957 | 7,415 | 5,601 | 6,884 | 8,028 | 7,848 | 7,609 | 9,364 | 9,032 |
| 2015 | 8,362 | 8,409 | 8,949 | 8,451 | 7,777 | 8,142 | 8,246 | 9,738 | 8,316 | 9,244 | 7,819 | 8,184 |
| 2016 | 8,082 | 7,117 | 7,311 | 7,303 | 7,233 | 8,151 | 8,122 | 8,202 | 8,984 | 9,163 | 9,382 | 7,435 |
| 2017 | 9,656 | 7,454 | 8,718 | 8,222 | 7,190 | 7,680 | 7,865 | 6,867 | 8,947 | 8,398 | 7,572 | 8,492 |
| 2018 | 9,385 | 8,593 | 9,385 | 8,770 | 8,557 | 9,462 | 9,691 | 9,608 | 9,290 | 9,723 | 9,921 | 8,718 |
| 2019 | 9,805 | 8,612 | 8,882 | 8,104 | 9,682 | 9,143 | 11,292 | 10,272 | 9,453 | 8,868 | 8,445 | 9,686 |
| 2020 | 9,399 | 9,112 | 8,709 | 8,224 | 8,288 | 9,556 | 10,121 | 8,098 | 8,967 | 7,769 | 8,867 | 9,219 |
| 2021 | 9,105 | 8,213 | 9,026 | 8,658 | 9,173 | 8,740 | 9,268 | 8,937 | 9,748 | 8,228 | 9,411 | 9,927 |
| 2022 | 9,208 | 8,105 | 9,816 | 7,324 | 6,514 | 7,952 | 9,273 | 8,585 | 8,513 | 9,137 | 8,212 | 8,756 |
| 2023 | 9,022 | 8,548 | 8,153 | 6,010 | 6,598 | 7,246 | 7,399 | 8,592 | 7,238 | 8,477 | 7,614 | 8,598 |
| 2024 | 7,528 | |||||||||||
| - = No Data Reported; -- = Not Applicable; NA = Not Available; W = Withheld to avoid disclosure of individual company data. |
| Release Date: 3/29/2024 |
| Next Release Date: 4/30/2024 |