|
Download Data (XLS File) |
|
||||||||
|
||||||||
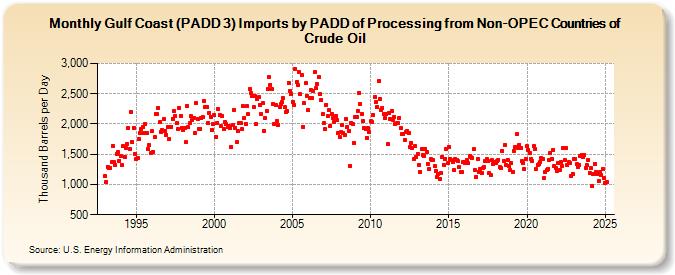
| Gulf Coast (PADD 3) Imports by PADD of Processing from Non-OPEC Countries of Crude Oil (Thousand Barrels per Day) | ||||||||
| Year | Jan | Feb | Mar | Apr | May | Jun | Jul | Aug | Sep | Oct | Nov | Dec |
|---|---|---|---|---|---|---|---|---|---|---|---|---|
| 1993 | 1,135 | 1,043 | 1,297 | 1,274 | 1,269 | 1,365 | 1,639 | 1,364 | 1,327 | 1,508 | 1,529 | 1,393 |
| 1994 | 1,463 | 1,316 | 1,630 | 1,450 | 1,602 | 1,670 | 1,933 | 1,594 | 2,200 | 1,699 | 1,938 | 1,508 |
| 1995 | 1,425 | 1,444 | 1,756 | 1,852 | 1,916 | 1,942 | 1,848 | 1,998 | 1,859 | 1,590 | 1,649 | 1,515 |
| 1996 | 1,879 | 1,539 | 1,781 | 2,159 | 2,157 | 2,268 | 2,027 | 1,868 | 1,898 | 2,077 | 1,887 | 1,818 |
| 1997 | 1,954 | 1,747 | 1,949 | 1,957 | 2,089 | 2,211 | 2,128 | 2,019 | 1,915 | 2,271 | 2,140 | 1,939 |
| 1998 | 1,895 | 1,937 | 1,696 | 2,293 | 1,942 | 2,010 | 2,125 | 2,061 | 2,102 | 1,857 | 2,342 | 2,082 |
| 1999 | 1,925 | 1,924 | 2,092 | 2,114 | 2,380 | 2,288 | 2,276 | 2,008 | 2,189 | 2,120 | 1,906 | 1,992 |
| 2000 | 2,150 | 1,791 | 2,024 | 2,246 | 2,151 | 1,964 | 2,140 | 1,911 | 2,029 | 1,997 | 1,946 | 1,963 |
| 2001 | 1,938 | 1,617 | 1,977 | 2,239 | 1,938 | 1,695 | 1,876 | 2,010 | 2,008 | 1,915 | 2,292 | 2,095 |
| 2002 | 2,000 | 2,292 | 2,161 | 2,582 | 2,516 | 2,458 | 2,280 | 2,459 | 1,999 | 2,416 | 2,445 | 2,315 |
| 2003 | 2,164 | 2,342 | 1,888 | 2,103 | 2,212 | 2,576 | 2,770 | 2,649 | 2,572 | 2,329 | 2,001 | 2,309 |
| 2004 | 2,048 | 1,976 | 2,288 | 2,322 | 2,360 | 2,425 | 2,275 | 2,191 | 2,213 | 2,684 | 2,547 | 2,500 |
| 2005 | 2,369 | 2,319 | 2,902 | 2,692 | 2,642 | 2,851 | 2,492 | 2,812 | 1,958 | 2,340 | 2,676 | 2,465 |
| 2006 | 2,229 | 2,423 | 2,560 | 2,422 | 2,551 | 2,856 | 2,590 | 2,664 | 2,770 | 2,492 | 2,399 | 2,160 |
| 2007 | 2,011 | 1,909 | 2,319 | 2,134 | 2,225 | 1,972 | 2,173 | 2,097 | 2,036 | 2,132 | 2,064 | 1,855 |
| 2008 | 1,784 | 1,860 | 1,987 | 1,848 | 1,819 | 2,084 | 1,958 | 1,890 | 1,312 | 2,021 | 1,994 | 1,693 |
| 2009 | 2,119 | 2,117 | 2,212 | 2,514 | 2,328 | 2,170 | 2,048 | 1,938 | 1,915 | 1,773 | 1,930 | 1,866 |
| 2010 | 2,044 | 2,036 | 2,153 | 2,450 | 2,367 | 2,278 | 2,704 | 2,418 | 2,225 | 2,266 | 2,164 | 2,099 |
| 2011 | 2,171 | 1,662 | 2,185 | 2,082 | 2,211 | 2,073 | 2,119 | 1,997 | 2,009 | 2,011 | 2,103 | 1,930 |
| 2012 | 1,833 | 1,836 | 1,743 | 1,868 | 1,882 | 1,850 | 1,612 | 1,691 | 1,606 | 1,425 | 1,629 | 1,457 |
| 2013 | 1,508 | 1,328 | 1,208 | 1,590 | 1,490 | 1,470 | 1,587 | 1,531 | 1,335 | 1,252 | 1,414 | 1,406 |
| 2014 | 1,399 | 1,298 | 1,228 | 1,128 | 1,173 | 1,089 | 1,185 | 1,461 | 1,328 | 1,423 | 1,585 | 1,347 |
| 2015 | 1,620 | 1,417 | 1,398 | 1,375 | 1,232 | 1,419 | 1,399 | 1,381 | 1,281 | 1,204 | 1,205 | 1,370 |
| 2016 | 1,363 | 1,366 | 1,401 | 1,347 | 1,464 | 1,446 | 1,439 | 1,582 | 1,240 | 1,125 | 1,415 | 1,214 |
| 2017 | 1,254 | 1,187 | 1,266 | 1,288 | 1,384 | 1,414 | 1,396 | 1,184 | 1,150 | 1,407 | 1,345 | 1,375 |
| 2018 | 1,357 | 1,387 | 1,408 | 1,284 | 1,268 | 1,557 | 1,388 | 1,658 | 1,324 | 1,409 | 1,307 | 1,233 |
| 2019 | 1,348 | 1,202 | 1,561 | 1,626 | 1,829 | 1,611 | 1,657 | 1,607 | 1,381 | 1,354 | 1,254 | 1,418 |
| 2020 | 1,630 | 1,568 | 1,515 | 1,429 | 1,391 | 1,635 | 1,590 | 1,252 | 1,329 | 1,332 | 1,365 | 1,438 |
| 2021 | 1,414 | 1,111 | 1,212 | 1,239 | 1,260 | 1,405 | 1,521 | 1,428 | 1,575 | 1,305 | 1,272 | 1,223 |
| 2022 | 1,352 | 1,245 | 1,371 | 1,306 | 1,600 | 1,403 | 1,596 | 1,317 | 1,364 | 1,356 | 1,133 | 1,181 |
| 2023 | 1,205 | 1,162 | 1,144 | 1,128 | 1,244 | 1,344 | 1,378 | 1,262 | 1,317 | 1,142 | 1,277 | 1,374 |
| 2024 | 1,192 | |||||||||||
| - = No Data Reported; -- = Not Applicable; NA = Not Available; W = Withheld to avoid disclosure of individual company data. |
| Release Date: 3/29/2024 |
| Next Release Date: 4/30/2024 |