|
Download Data (XLS File) |
|
||||||||
|
||||||||
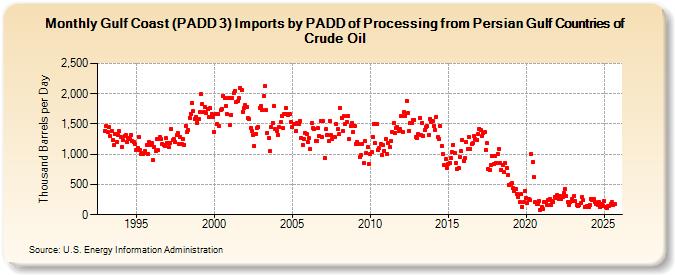
| Gulf Coast (PADD 3) Imports by PADD of Processing from Persian Gulf Countries of Crude Oil (Thousand Barrels per Day) | ||||||||
| Year | Jan | Feb | Mar | Apr | May | Jun | Jul | Aug | Sep | Oct | Nov | Dec |
|---|---|---|---|---|---|---|---|---|---|---|---|---|
| 1993 | 1,392 | 1,465 | 1,363 | 1,445 | 1,305 | 1,382 | 1,233 | 1,150 | 1,337 | 1,207 | 1,325 | 1,381 |
| 1994 | 1,290 | 1,120 | 1,230 | 1,303 | 1,312 | 1,199 | 1,276 | 1,253 | 1,315 | 1,221 | 1,195 | 1,175 |
| 1995 | 1,063 | 1,107 | 1,287 | 1,072 | 1,004 | 1,006 | 1,027 | 1,050 | 1,160 | 1,010 | 1,194 | 1,156 |
| 1996 | 1,179 | 897 | 1,123 | 1,056 | 1,248 | 1,062 | 1,284 | 1,245 | 1,173 | 1,160 | 1,142 | 1,260 |
| 1997 | 1,193 | 1,114 | 1,192 | 1,418 | 1,235 | 1,251 | 1,199 | 1,311 | 1,344 | 1,163 | 1,290 | 1,170 |
| 1998 | 1,248 | 1,159 | 1,474 | 1,364 | 1,398 | 1,607 | 1,673 | 1,848 | 1,707 | 1,589 | 1,623 | 1,521 |
| 1999 | 1,584 | 1,693 | 1,991 | 1,827 | 1,704 | 1,783 | 1,675 | 1,746 | 1,616 | 1,764 | 1,669 | 1,620 |
| 2000 | 1,373 | 1,661 | 1,493 | 1,673 | 1,464 | 1,725 | 1,745 | 1,967 | 1,922 | 1,805 | 1,664 | 1,936 |
| 2001 | 1,482 | 1,649 | 1,935 | 2,007 | 2,048 | 1,855 | 1,876 | 1,926 | 2,096 | 2,061 | 1,705 | 1,770 |
| 2002 | 1,807 | 1,786 | 1,593 | 1,577 | 1,441 | 1,385 | 1,324 | 1,139 | 1,334 | 1,435 | 1,452 | 1,761 |
| 2003 | 1,795 | 1,729 | 1,955 | 2,124 | 1,725 | 1,356 | 1,265 | 1,046 | 1,451 | 1,521 | 1,801 | 1,417 |
| 2004 | 1,392 | 1,313 | 1,445 | 1,531 | 1,639 | 1,426 | 1,669 | 1,770 | 1,664 | 1,641 | 1,659 | 1,536 |
| 2005 | 1,457 | 1,501 | 1,500 | 1,383 | 1,508 | 1,503 | 1,546 | 1,273 | 1,157 | 1,249 | 1,353 | 1,328 |
| 2006 | 1,205 | 1,261 | 1,085 | 1,518 | 1,431 | 1,425 | 1,213 | 1,225 | 1,427 | 1,303 | 1,555 | 1,277 |
| 2007 | 1,547 | 936 | 1,411 | 1,325 | 1,215 | 1,556 | 1,310 | 1,250 | 1,280 | 1,284 | 1,496 | 1,411 |
| 2008 | 1,328 | 1,766 | 1,607 | 1,386 | 1,624 | 1,501 | 1,537 | 1,628 | 1,255 | 1,468 | 1,513 | 1,365 |
| 2009 | 1,462 | 1,171 | 1,207 | 1,176 | 946 | 981 | 1,172 | 856 | 1,211 | 1,022 | 1,113 | 838 |
| 2010 | 1,005 | 1,031 | 1,286 | 1,507 | 1,178 | 1,500 | 1,062 | 1,095 | 1,167 | 981 | 1,150 | 1,059 |
| 2011 | 1,247 | 1,004 | 1,184 | 1,113 | 1,223 | 1,366 | 1,514 | 1,354 | 1,436 | 1,453 | 1,389 | 1,420 |
| 2012 | 1,628 | 1,373 | 1,693 | 1,631 | 1,888 | 1,674 | 1,389 | 1,516 | 1,514 | 1,571 | 1,572 | 1,286 |
| 2013 | 1,262 | 1,335 | 1,601 | 1,313 | 1,522 | 1,307 | 1,403 | 1,448 | 1,460 | 1,319 | 1,584 | 1,537 |
| 2014 | 1,547 | 1,463 | 1,400 | 1,623 | 1,281 | 1,250 | 1,466 | 1,141 | 996 | 815 | 914 | 778 |
| 2015 | 836 | 853 | 941 | 1,035 | 1,159 | 1,014 | 858 | 763 | 767 | 952 | 1,047 | 1,243 |
| 2016 | 891 | 935 | 1,207 | 1,086 | 1,281 | 1,087 | 1,176 | 1,179 | 1,305 | 1,247 | 1,239 | 1,335 |
| 2017 | 1,425 | 1,398 | 1,298 | 1,344 | 1,363 | 1,077 | 1,181 | 751 | 744 | 826 | 975 | 836 |
| 2018 | 967 | 856 | 1,001 | 1,090 | 858 | 745 | 826 | 705 | 858 | 780 | 655 | 496 |
| 2019 | 507 | 520 | 436 | 388 | 430 | 350 | 299 | 209 | 340 | 133 | 209 | 396 |
| 2020 | 284 | 197 | 259 | 239 | 1,001 | 879 | 620 | 202 | 171 | 172 | 228 | 86 |
| 2021 | 127 | 102 | 214 | 204 | 164 | 247 | 253 | 153 | 232 | 204 | 300 | 283 |
| 2022 | 324 | 266 | 302 | 262 | 287 | 352 | 429 | 302 | 214 | 163 | 213 | 258 |
| 2023 | 219 | 313 | 219 | 160 | 147 | 158 | 192 | 288 | 235 | 125 | 121 | 152 |
| 2024 | 131 | |||||||||||
| - = No Data Reported; -- = Not Applicable; NA = Not Available; W = Withheld to avoid disclosure of individual company data. |
| Release Date: 3/29/2024 |
| Next Release Date: 4/30/2024 |