|
Download Data (XLS File) |
|
||||||||
|
||||||||
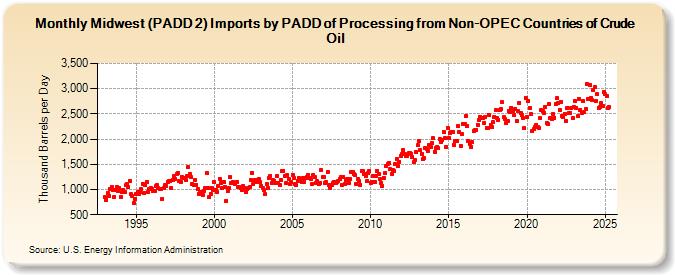
| Midwest (PADD 2) Imports by PADD of Processing from Non-OPEC Countries of Crude Oil (Thousand Barrels per Day) | ||||||||
| Year | Jan | Feb | Mar | Apr | May | Jun | Jul | Aug | Sep | Oct | Nov | Dec |
|---|---|---|---|---|---|---|---|---|---|---|---|---|
| 1993 | 845 | 799 | 937 | 880 | 1,005 | 1,046 | 993 | 851 | 999 | 1,057 | 963 | 1,025 |
| 1994 | 852 | 948 | 997 | 942 | 1,080 | 1,106 | 1,054 | 1,176 | 905 | 865 | 731 | 817 |
| 1995 | 917 | 955 | 909 | 950 | 1,015 | 1,115 | 940 | 1,080 | 1,158 | 950 | 1,008 | 1,025 |
| 1996 | 1,009 | 962 | 975 | 1,064 | 1,083 | 1,029 | 1,012 | 1,006 | 820 | 1,026 | 1,084 | 1,075 |
| 1997 | 1,154 | 1,165 | 1,163 | 1,029 | 1,195 | 1,272 | 1,210 | 1,298 | 1,333 | 1,164 | 1,154 | 1,249 |
| 1998 | 1,231 | 1,222 | 1,182 | 1,262 | 1,437 | 1,313 | 1,242 | 1,115 | 1,096 | 1,185 | 1,098 | 1,003 |
| 1999 | 910 | 939 | 950 | 893 | 972 | 1,028 | 1,320 | 1,036 | 848 | 917 | 1,034 | 984 |
| 2000 | 1,148 | 997 | 954 | 1,070 | 1,217 | 1,122 | 1,021 | 1,154 | 1,050 | 773 | 962 | 1,035 |
| 2001 | 1,247 | 1,139 | 1,145 | 1,139 | 1,111 | 1,157 | 1,057 | 1,053 | 1,037 | 996 | 1,074 | 1,038 |
| 2002 | 946 | 1,002 | 1,023 | 1,046 | 1,192 | 1,337 | 1,117 | 1,184 | 1,155 | 1,187 | 1,210 | 1,142 |
| 2003 | 1,075 | 1,022 | 981 | 905 | 1,107 | 1,032 | 1,228 | 1,274 | 1,125 | 1,184 | 1,177 | 1,131 |
| 2004 | 1,263 | 1,121 | 1,093 | 1,193 | 1,376 | 1,374 | 1,270 | 1,125 | 1,279 | 1,218 | 1,119 | 1,143 |
| 2005 | 1,288 | 1,222 | 1,104 | 1,081 | 1,174 | 1,232 | 1,201 | 1,145 | 1,233 | 1,154 | 1,235 | 1,249 |
| 2006 | 1,288 | 1,224 | 1,217 | 1,117 | 1,295 | 1,239 | 1,135 | 1,168 | 1,107 | 1,139 | 1,383 | 1,251 |
| 2007 | 1,251 | 1,134 | 1,146 | 1,354 | 1,089 | 1,039 | 1,083 | 1,136 | 1,141 | 1,123 | 1,155 | 1,170 |
| 2008 | 1,214 | 1,248 | 1,096 | 1,254 | 1,102 | 1,190 | 1,204 | 1,127 | 1,202 | 1,355 | 1,355 | 1,302 |
| 2009 | 1,285 | 1,105 | 1,218 | 1,162 | 1,098 | 1,370 | 1,363 | 1,316 | 1,263 | 1,166 | 1,324 | 1,361 |
| 2010 | 1,136 | 1,157 | 1,269 | 1,146 | 1,272 | 1,370 | 1,302 | 1,206 | 1,133 | 1,074 | 1,237 | 1,326 |
| 2011 | 1,467 | 1,501 | 1,531 | 1,399 | 1,311 | 1,389 | 1,370 | 1,506 | 1,609 | 1,464 | 1,551 | 1,667 |
| 2012 | 1,700 | 1,782 | 1,712 | 1,665 | 1,671 | 1,719 | 1,730 | 1,700 | 1,642 | 1,537 | 1,582 | 1,736 |
| 2013 | 1,878 | 1,955 | 1,784 | 1,706 | 1,597 | 1,628 | 1,822 | 1,800 | 1,764 | 1,886 | 1,850 | 1,916 |
| 2014 | 2,014 | 1,750 | 1,816 | 1,843 | 1,815 | 2,002 | 1,943 | 1,981 | 2,145 | 2,028 | 1,853 | 2,220 |
| 2015 | 2,026 | 2,128 | 2,135 | 2,145 | 1,889 | 1,971 | 1,957 | 2,258 | 2,143 | 1,873 | 2,110 | 2,305 |
| 2016 | 2,292 | 2,451 | 2,265 | 1,968 | 1,908 | 1,850 | 1,940 | 2,165 | 2,179 | 2,190 | 2,287 | 2,381 |
| 2017 | 2,439 | 2,427 | 2,416 | 2,314 | 2,447 | 2,222 | 2,226 | 2,469 | 2,285 | 2,239 | 2,339 | 2,448 |
| 2018 | 2,570 | 2,409 | 2,382 | 2,574 | 2,595 | 2,726 | 2,431 | 2,395 | 2,314 | 2,367 | 2,555 | 2,528 |
| 2019 | 2,625 | 2,551 | 2,480 | 2,598 | 2,368 | 2,560 | 2,722 | 2,515 | 2,476 | 2,414 | 2,211 | 2,824 |
| 2020 | 2,440 | 2,764 | 2,621 | 2,494 | 2,151 | 2,191 | 2,241 | 2,284 | 2,238 | 2,216 | 2,410 | 2,577 |
| 2021 | 2,549 | 2,521 | 2,643 | 2,317 | 2,306 | 2,706 | 2,416 | 2,393 | 2,499 | 2,426 | 2,695 | 2,809 |
| 2022 | 2,718 | 2,580 | 2,741 | 2,465 | 2,447 | 2,488 | 2,362 | 2,623 | 2,521 | 2,522 | 2,620 | 2,419 |
| 2023 | 2,829 | 3,001 | 2,796 | 2,592 | 2,885 | 2,698 | 2,636 | 2,933 | 2,710 | 2,719 | 3,135 | 2,816 |
| 2024 | 3,083 | |||||||||||
| - = No Data Reported; -- = Not Applicable; NA = Not Available; W = Withheld to avoid disclosure of individual company data. |
| Release Date: 3/29/2024 |
| Next Release Date: 4/30/2024 |