|
Download Data (XLS File) |
|
||||||||
|
||||||||
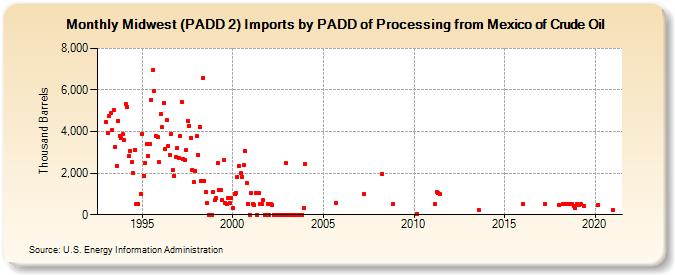
| Midwest (PADD 2) Imports by PADD of Processing from Mexico of Crude Oil (Thousand Barrels) | ||||||||
| Year | Jan | Feb | Mar | Apr | May | Jun | Jul | Aug | Sep | Oct | Nov | Dec |
|---|---|---|---|---|---|---|---|---|---|---|---|---|
| 1993 | 4,472 | 3,911 | 4,770 | 4,881 | 4,076 | 5,055 | 3,263 | 2,367 | 4,517 | 3,807 | 3,674 | 3,859 |
| 1994 | 3,570 | 5,313 | 5,165 | 2,810 | 3,066 | 2,514 | 2,002 | 3,132 | 513 | 501 | 999 | |
| 1995 | 3,888 | 1,864 | 2,481 | 3,391 | 2,843 | 3,418 | 5,521 | 6,972 | 5,950 | 3,791 | 3,720 | 2,526 |
| 1996 | 4,837 | 4,203 | 5,392 | 3,145 | 4,546 | 3,288 | 2,891 | 3,878 | 2,137 | 1,873 | 2,770 | 3,204 |
| 1997 | 2,724 | 3,766 | 5,430 | 2,665 | 2,652 | 3,136 | 4,529 | 4,291 | 3,710 | 2,169 | 1,563 | 2,103 |
| 1998 | 3,767 | 2,896 | 4,232 | 1,637 | 6,568 | 1,622 | 1,075 | 550 | 0 | 0 | 0 | 1,100 |
| 1999 | 693 | 796 | 2,510 | 1,197 | 1,175 | 696 | 2,614 | 546 | 508 | 783 | 547 | 781 |
| 2000 | 301 | 1,012 | 1,052 | 1,807 | 2,349 | 1,991 | 1,816 | 2,372 | 3,079 | 1,504 | 527 | 0 |
| 2001 | 1,038 | 529 | 478 | 1,035 | 0 | 1,051 | 507 | 529 | 693 | 0 | 0 | 528 |
| 2002 | 0 | 527 | 478 | 0 | 0 | 0 | 0 | 0 | 0 | 0 | 0 | 2,486 |
| 2003 | 0 | 0 | 0 | 0 | 0 | 0 | 0 | 0 | 0 | 0 | 0 | 304 |
| 2004 | 2,433 | |||||||||||
| 2005 | 578 | |||||||||||
| 2007 | 992 | |||||||||||
| 2008 | 1,972 | 499 | ||||||||||
| 2010 | 41 | |||||||||||
| 2011 | 498 | 1,098 | 1,023 | 989 | ||||||||
| 2013 | 220 | |||||||||||
| 2016 | 510 | |||||||||||
| 2017 | 498 | |||||||||||
| 2018 | 489 | 499 | 508 | 498 | 510 | 507 | 499 | 509 | 443 | 299 | ||
| 2019 | 507 | 454 | 497 | 397 | ||||||||
| 2020 | 477 | |||||||||||
| 2021 | 204 | |||||||||||
| - = No Data Reported; -- = Not Applicable; NA = Not Available; W = Withheld to avoid disclosure of individual company data. |
| Release Date: 3/29/2024 |
| Next Release Date: 4/30/2024 |