|
Download Data (XLS File) |
|
||||||||
|
||||||||
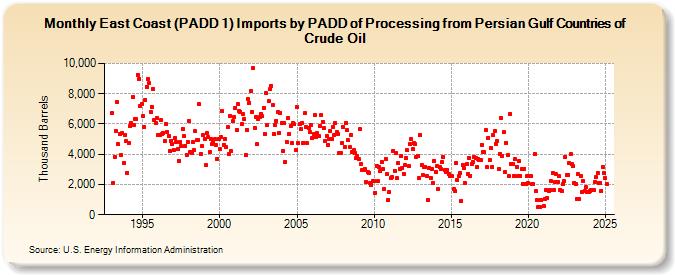
| East Coast (PADD 1) Imports by PADD of Processing from Persian Gulf Countries of Crude Oil (Thousand Barrels) | ||||||||
| Year | Jan | Feb | Mar | Apr | May | Jun | Jul | Aug | Sep | Oct | Nov | Dec |
|---|---|---|---|---|---|---|---|---|---|---|---|---|
| 1993 | 6,701 | 2,115 | 3,823 | 5,535 | 7,435 | 4,644 | 5,340 | 3,969 | 5,416 | 3,439 | 5,295 | 4,873 |
| 1994 | 2,781 | 4,763 | 5,855 | 6,063 | 7,773 | 5,932 | 6,312 | 6,328 | 9,255 | 8,989 | 7,198 | 7,318 |
| 1995 | 6,505 | 5,803 | 7,613 | 8,445 | 8,944 | 8,685 | 6,810 | 7,153 | 8,345 | 6,275 | 6,074 | 6,390 |
| 1996 | 5,296 | 5,299 | 6,239 | 5,348 | 5,402 | 4,871 | 5,990 | 5,456 | 5,228 | 4,204 | 4,893 | 4,657 |
| 1997 | 4,282 | 5,089 | 4,828 | 4,334 | 3,577 | 4,816 | 4,526 | 5,693 | 5,190 | 4,560 | 3,949 | 4,835 |
| 1998 | 6,171 | 4,173 | 4,060 | 4,806 | 4,257 | 5,515 | 4,917 | 4,911 | 7,290 | 4,016 | 4,537 | 5,302 |
| 1999 | 4,995 | 3,263 | 5,384 | 5,109 | 4,135 | 4,985 | 4,662 | 4,782 | 4,977 | 4,621 | 3,693 | 4,986 |
| 2000 | 4,323 | 5,114 | 6,839 | 4,633 | 5,015 | 4,470 | 5,779 | 3,999 | 6,541 | 4,196 | 6,170 | 6,483 |
| 2001 | 7,085 | 5,585 | 7,300 | 6,889 | 6,821 | 5,995 | 6,635 | 6,323 | 3,944 | 5,633 | 7,624 | 7,406 |
| 2002 | 8,165 | 6,809 | 9,689 | 5,753 | 6,443 | 4,644 | 6,326 | 6,445 | 6,677 | 6,502 | 7,075 | 5,342 |
| 2003 | 8,065 | 5,910 | 7,494 | 8,280 | 8,527 | 7,264 | 5,349 | 5,936 | 6,191 | 6,775 | 5,422 | 6,758 |
| 2004 | 6,048 | 4,219 | 6,075 | 3,513 | 4,840 | 6,422 | 5,330 | 5,882 | 4,723 | 6,040 | 5,981 | 4,278 |
| 2005 | 7,120 | 4,737 | 5,990 | 5,651 | 6,090 | 4,767 | 6,699 | 5,815 | 4,736 | 5,730 | 5,464 | 5,931 |
| 2006 | 5,084 | 5,319 | 6,562 | 5,148 | 5,383 | 5,212 | 5,874 | 6,570 | 6,161 | 5,724 | 4,859 | 5,201 |
| 2007 | 4,627 | 4,987 | 5,518 | 5,038 | 5,786 | 5,257 | 6,048 | 5,447 | 5,342 | 4,073 | 4,067 | 4,738 |
| 2008 | 5,803 | 4,489 | 6,067 | 5,573 | 4,915 | 4,451 | 5,301 | 4,158 | 4,269 | 4,067 | 3,727 | 3,909 |
| 2009 | 3,663 | 5,644 | 3,354 | 2,948 | 2,927 | 3,004 | 2,165 | 2,797 | 2,782 | 2,090 | 1,994 | 2,202 |
| 2010 | 2,212 | 1,463 | 3,253 | 2,207 | 3,156 | 2,894 | 3,471 | 3,028 | 1,695 | 3,696 | 2,680 | 1,002 |
| 2011 | 1,497 | 2,410 | 2,471 | 4,232 | 2,919 | 4,112 | 2,413 | 3,424 | 3,041 | 3,884 | 3,065 | 2,710 |
| 2012 | 3,300 | 3,766 | 4,255 | 3,200 | 4,661 | 4,978 | 4,337 | 4,739 | 4,653 | 3,828 | 3,911 | 2,408 |
| 2013 | 5,265 | 3,299 | 2,632 | 3,153 | 3,176 | 2,535 | 998 | 3,117 | 2,430 | 3,030 | 2,098 | 3,558 |
| 2014 | 2,850 | 3,208 | 1,688 | 3,143 | 3,026 | 3,495 | 3,807 | 2,947 | 2,841 | 2,963 | 2,666 | 2,532 |
| 2015 | 2,529 | 1,711 | 1,549 | 3,429 | 2,275 | 2,561 | 2,752 | 930 | 3,300 | 3,057 | 2,079 | |
| 2016 | 3,326 | 2,714 | 3,724 | 2,580 | 3,343 | 3,487 | 3,820 | 3,752 | 3,140 | 3,679 | 3,591 | 3,585 |
| 2017 | 4,631 | 4,169 | 4,138 | 5,600 | 3,135 | 5,091 | 3,632 | 4,399 | 3,187 | 5,262 | 5,522 | 4,704 |
| 2018 | 4,842 | 2,992 | 4,024 | 6,385 | 3,906 | 5,452 | 2,806 | 4,760 | 3,931 | 2,547 | 6,677 | 3,321 |
| 2019 | 3,341 | 2,567 | 3,659 | 3,188 | 2,568 | 3,548 | 2,547 | 3,035 | 2,042 | 3,048 | 2,056 | 2,551 |
| 2020 | 2,077 | 2,536 | 2,542 | 2,013 | 2,013 | 4,017 | 1,540 | 1,004 | 508 | 502 | 1,002 | |
| 2021 | 548 | 1,054 | 1,640 | 1,104 | 1,599 | 1,641 | 2,201 | 2,749 | 1,648 | 2,147 | 2,673 | 2,161 |
| 2022 | 2,543 | 1,650 | 1,572 | 2,024 | 2,202 | 3,822 | 2,616 | 2,628 | 3,388 | 3,993 | 3,329 | 3,199 |
| 2023 | 2,117 | 2,051 | 1,061 | 2,666 | 1,061 | 2,573 | 1,476 | 2,198 | 1,559 | 1,808 | 1,503 | 1,502 |
| 2024 | 1,588 | |||||||||||
| - = No Data Reported; -- = Not Applicable; NA = Not Available; W = Withheld to avoid disclosure of individual company data. |
| Release Date: 3/29/2024 |
| Next Release Date: 4/30/2024 |