|
Download Data (XLS File) |
|
||||||||
|
||||||||
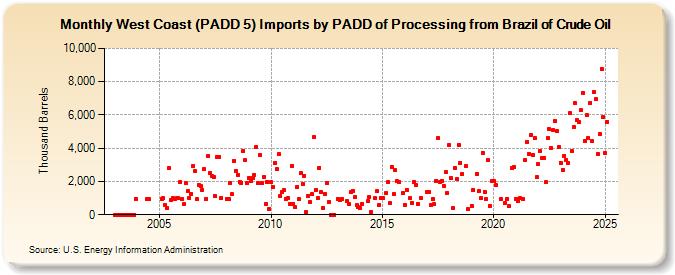
| West Coast (PADD 5) Imports by PADD of Processing from Brazil of Crude Oil (Thousand Barrels) | ||||||||
| Year | Jan | Feb | Mar | Apr | May | Jun | Jul | Aug | Sep | Oct | Nov | Dec |
|---|---|---|---|---|---|---|---|---|---|---|---|---|
| 2003 | 0 | 0 | 0 | 0 | 0 | 0 | 0 | 0 | 0 | 0 | 0 | 953 |
| 2004 | 948 | 945 | ||||||||||
| 2005 | 971 | 980 | 592 | 393 | 2,807 | 862 | 978 | 953 | 983 | 982 | 1,973 | |
| 2006 | 967 | 617 | 1,891 | 1,413 | 1,013 | 1,252 | 2,938 | 2,621 | 929 | 1,773 | 1,707 | 1,491 |
| 2007 | 2,726 | 964 | 3,510 | 2,498 | 2,357 | 2,245 | 1,117 | 3,462 | 3,489 | 977 | ||
| 2008 | 960 | 948 | 1,908 | 1,226 | 3,250 | 2,650 | 2,411 | 1,996 | 1,922 | 3,833 | 3,271 | 1,883 |
| 2009 | 2,232 | 1,997 | 2,232 | 2,392 | 4,050 | 1,877 | 3,619 | 1,889 | 2,275 | 631 | 1,996 | 370 |
| 2010 | 1,939 | 1,674 | 3,096 | 2,743 | 3,624 | 1,155 | 1,394 | 1,458 | 945 | 991 | 632 | 2,947 |
| 2011 | 648 | 435 | 1,640 | 929 | 2,525 | 1,844 | 2,330 | 181 | 1,143 | 759 | 1,226 | 4,645 |
| 2012 | 1,478 | 997 | 2,835 | 1,373 | 431 | 1,241 | 1,919 | 778 | 1 | 1 | 1 | |
| 2013 | 966 | 902 | 943 | 839 | 636 | 1,339 | 1,446 | 1,045 | 557 | 439 | ||
| 2014 | 410 | 634 | 795 | 1,043 | 168 | 1,000 | 1,402 | 597 | 1,021 | |||
| 2015 | 1,000 | 1,295 | 1,944 | 697 | 2,876 | 1,243 | 2,664 | 2,003 | 1,952 | 1,288 | ||
| 2016 | 612 | 1,488 | 987 | 725 | 1,974 | 1,792 | 665 | 981 | ||||
| 2017 | 1,389 | 1,370 | 588 | 930 | 616 | 2,054 | 4,626 | 1,992 | 2,051 | 1,755 | 2,539 | 1,319 |
| 2018 | 4,185 | 2,187 | 385 | 2,831 | 2,123 | 4,193 | 3,134 | 2,449 | 2,924 | 318 | ||
| 2019 | 548 | 1,487 | 2,454 | 1,425 | 985 | 3,736 | 1,384 | 944 | 3,283 | 554 | 1,998 | |
| 2020 | 2,023 | 1,774 | 927 | 726 | 936 | 508 | 2,836 | 2,867 | ||||
| 2021 | 962 | 827 | 985 | 956 | 3,274 | 4,396 | 3,658 | 4,797 | 3,587 | 4,595 | 2,251 | |
| 2022 | 3,032 | 3,821 | 3,385 | 3,420 | 1,939 | 4,583 | 5,131 | 4,004 | 5,074 | 5,619 | 5,017 | 4,067 |
| 2023 | 3,129 | 2,706 | 3,534 | 3,293 | 3,094 | 6,098 | 3,677 | 5,268 | 6,695 | 5,669 | 5,573 | 6,272 |
| 2024 | 7,322 | |||||||||||
| - = No Data Reported; -- = Not Applicable; NA = Not Available; W = Withheld to avoid disclosure of individual company data. |
| Release Date: 3/29/2024 |
| Next Release Date: 4/30/2024 |