|
Download Data (XLS File) |
|
||||||||
|
||||||||
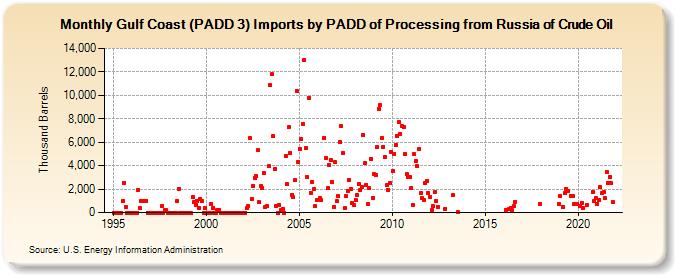
| Gulf Coast (PADD 3) Imports by PADD of Processing from Russia of Crude Oil (Thousand Barrels) | ||||||||
| Year | Jan | Feb | Mar | Apr | May | Jun | Jul | Aug | Sep | Oct | Nov | Dec |
|---|---|---|---|---|---|---|---|---|---|---|---|---|
| 1995 | 0 | 0 | 0 | 0 | 0 | 0 | 1,003 | 2,551 | 460 | 0 | 0 | 0 |
| 1996 | 0 | 0 | 0 | 0 | 1,948 | 429 | 1,017 | 998 | 1,017 | 1,008 | 0 | 0 |
| 1997 | 0 | 0 | 0 | 0 | 0 | 0 | 0 | 575 | 0 | 180 | 200 | 0 |
| 1998 | 0 | 0 | 0 | 0 | 0 | 1,006 | 2,044 | 0 | 0 | 0 | 0 | 0 |
| 1999 | 0 | 0 | 0 | 1,288 | 859 | 660 | 1,002 | 420 | 1,168 | 962 | 0 | 371 |
| 2000 | 0 | 0 | 0 | 761 | 400 | 0 | 0 | 198 | 247 | 0 | 0 | 0 |
| 2001 | 0 | 0 | 0 | 0 | 0 | 0 | 0 | 0 | 0 | 0 | 0 | 0 |
| 2002 | 0 | 0 | 376 | 580 | 6,330 | 1,176 | 2,293 | 2,934 | 3,115 | 5,301 | 864 | 2,272 |
| 2003 | 2,080 | 3,400 | 500 | 565 | 3,936 | 10,839 | 11,814 | 6,494 | 3,674 | 562 | 0 | 644 |
| 2004 | 242 | 305 | 0 | 4,782 | 2,441 | 7,264 | 5,117 | 1,530 | 1,297 | 2,779 | 10,326 | 4,344 |
| 2005 | 5,462 | 6,288 | 7,571 | 12,980 | 5,479 | 2,990 | 9,775 | 1,678 | 2,621 | 1,987 | 551 | 1,054 |
| 2006 | 1,202 | 1,051 | 6,359 | 4,668 | 2,059 | 4,049 | 4,506 | 2,609 | 477 | 4,297 | ||
| 2007 | 955 | 1,383 | 5,982 | 7,357 | 5,082 | 423 | 1,405 | 1,842 | 2,795 | 1,992 | 808 | 640 |
| 2008 | 1,089 | 1,493 | 2,418 | 1,943 | 2,149 | 6,615 | 4,203 | 2,386 | 725 | 2,090 | 4,565 | 1,226 |
| 2009 | 3,253 | 3,223 | 5,573 | 8,835 | 9,167 | 6,380 | 5,624 | 4,711 | 2,334 | 1,927 | 2,516 | 5,196 |
| 2010 | 3,541 | 5,013 | 5,773 | 6,560 | 7,697 | 6,732 | 7,383 | 7,292 | 5,005 | 3,251 | 3,039 | 3,008 |
| 2011 | 2,126 | 665 | 4,973 | 4,432 | 3,935 | 5,390 | 1,647 | 1,203 | 1,090 | 2,543 | 2,720 | 1,666 |
| 2012 | 1,367 | 200 | 528 | 1,733 | 1,013 | 505 | 314 | |||||
| 2013 | 1,486 | 80 | ||||||||||
| 2016 | 250 | 299 | 356 | 181 | 529 | 930 | ||||||
| 2017 | 720 | |||||||||||
| 2018 | 718 | |||||||||||
| 2019 | 1,433 | 495 | 1,651 | 2,043 | 1,831 | 1,431 | 1,430 | 716 | 717 | |||
| 2020 | 519 | 848 | 396 | 637 | 1,757 | 994 | 1,218 | |||||
| 2021 | 718 | 1,068 | 2,180 | 1,631 | 1,746 | 1,212 | 3,442 | 2,520 | 3,074 | 2,491 | 859 | |
| - = No Data Reported; -- = Not Applicable; NA = Not Available; W = Withheld to avoid disclosure of individual company data. |
| Release Date: 3/29/2024 |
| Next Release Date: 4/30/2024 |