|
Download Data (XLS File) |
|
||||||||
|
||||||||
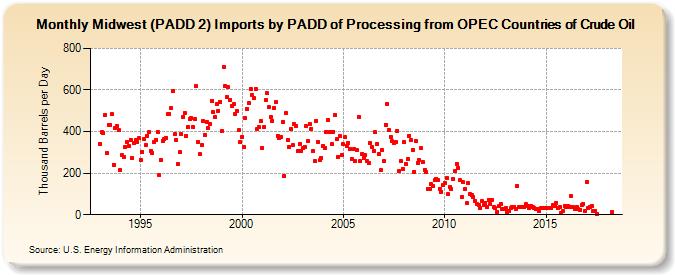
| Midwest (PADD 2) Imports by PADD of Processing from OPEC Countries of Crude Oil (Thousand Barrels per Day) | ||||||||
| Year | Jan | Feb | Mar | Apr | May | Jun | Jul | Aug | Sep | Oct | Nov | Dec |
|---|---|---|---|---|---|---|---|---|---|---|---|---|
| 1993 | 342 | 397 | 393 | 481 | 298 | 432 | 432 | 484 | 241 | 417 | 426 | 407 |
| 1994 | 215 | 285 | 278 | 328 | 349 | 330 | 361 | 272 | 345 | 360 | 350 | 367 |
| 1995 | 265 | 302 | 362 | 336 | 381 | 396 | 308 | 297 | 350 | 361 | 399 | 190 |
| 1996 | 264 | 356 | 363 | 369 | 484 | 484 | 512 | 595 | 386 | 361 | 244 | 300 |
| 1997 | 388 | 472 | 490 | 381 | 421 | 461 | 466 | 423 | 460 | 617 | 350 | 291 |
| 1998 | 334 | 451 | 385 | 447 | 416 | 438 | 548 | 494 | 468 | 533 | 499 | 544 |
| 1999 | 404 | 711 | 618 | 567 | 612 | 554 | 523 | 532 | 485 | 499 | 406 | 348 |
| 2000 | 374 | 328 | 463 | 510 | 535 | 607 | 575 | 560 | 604 | 413 | 420 | 449 |
| 2001 | 321 | 420 | 552 | 584 | 517 | 469 | 453 | 513 | 540 | 380 | 367 | 373 |
| 2002 | 448 | 187 | 488 | 361 | 326 | 412 | 333 | 434 | 428 | 307 | 339 | 307 |
| 2003 | 319 | 327 | 428 | 353 | 437 | 413 | 306 | 256 | 453 | 351 | 261 | 275 |
| 2004 | 331 | 323 | 400 | 455 | 399 | 340 | 400 | 482 | 362 | 280 | 378 | 286 |
| 2005 | 338 | 372 | 331 | 346 | 317 | 268 | 316 | 258 | 309 | 471 | 257 | 293 |
| 2006 | 273 | 287 | 259 | 251 | 343 | 324 | 308 | 396 | 341 | 292 | 213 | 311 |
| 2007 | 258 | 433 | 534 | 409 | 375 | 353 | 346 | 352 | 402 | 210 | 259 | 222 |
| 2008 | 350 | 246 | 268 | 381 | 360 | 313 | 206 | 356 | 250 | 261 | 319 | 252 |
| 2009 | 217 | 205 | 126 | 125 | 149 | 137 | 166 | 173 | 168 | 126 | 111 | 143 |
| 2010 | 153 | 176 | 98 | 131 | 122 | 171 | 211 | 245 | 227 | 165 | 86 | 156 |
| 2011 | 122 | 54 | 152 | 99 | 95 | 85 | 68 | 51 | 49 | 32 | 64 | 48 |
| 2012 | 57 | 35 | 72 | 51 | 70 | 37 | 31 | 15 | 40 | 51 | 29 | 26 |
| 2013 | 33 | 14 | 18 | 32 | 38 | 39 | 26 | 139 | 36 | 38 | 35 | 38 |
| 2014 | 50 | 44 | 32 | 44 | 38 | 30 | 27 | 26 | 20 | 30 | 32 | 32 |
| 2015 | 32 | 31 | 31 | 32 | 45 | 44 | 58 | 31 | 38 | 10 | 17 | 43 |
| 2016 | 36 | 41 | 39 | 88 | 35 | 27 | 36 | 26 | 24 | 47 | 53 | 17 |
| 2017 | 159 | 31 | 36 | 42 | 17 | 18 | 4 | |||||
| 2018 | 13 | |||||||||||
| - = No Data Reported; -- = Not Applicable; NA = Not Available; W = Withheld to avoid disclosure of individual company data. |
| Release Date: 3/29/2024 |
| Next Release Date: 4/30/2024 |