|
Download Data (XLS File) |
|
||||||||
|
||||||||
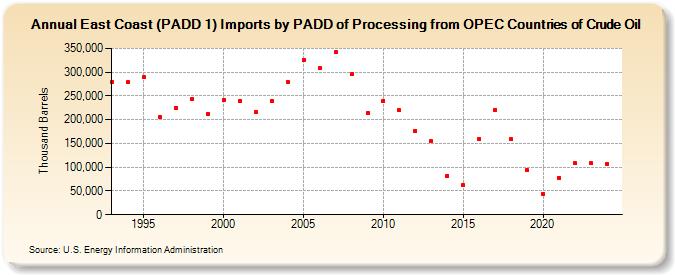
| East Coast (PADD 1) Imports by PADD of Processing from OPEC Countries of Crude Oil (Thousand Barrels) | ||||||||
| Decade | Year-0 | Year-1 | Year-2 | Year-3 | Year-4 | Year-5 | Year-6 | Year-7 | Year-8 | Year-9 |
|---|---|---|---|---|---|---|---|---|---|---|
| 1990's | 279,713 | 278,783 | 289,763 | 205,731 | 225,303 | 242,951 | 212,731 | |||
| 2000's | 241,133 | 240,068 | 215,255 | 238,843 | 279,793 | 325,983 | 307,982 | 341,666 | 295,244 | 214,420 |
| 2010's | 239,918 | 219,500 | 176,626 | 154,169 | 82,359 | 62,151 | 159,809 | 220,896 | 158,729 | 93,199 |
| 2020's | 44,297 | 77,581 | 108,018 | 108,061 |
| - = No Data Reported; -- = Not Applicable; NA = Not Available; W = Withheld to avoid disclosure of individual company data. |
| Release Date: 3/29/2024 |
| Next Release Date: 8/30/2024 |