|
Download Data (XLS File) |
|
||||||||
|
||||||||
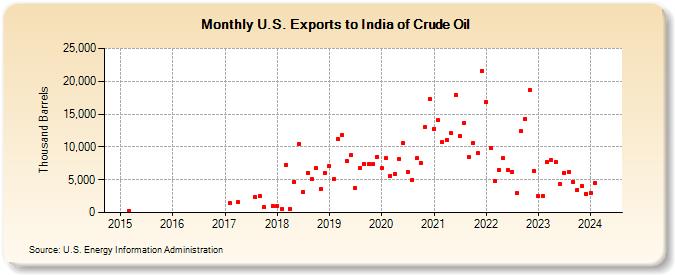
| U.S. Exports to India of Crude Oil (Thousand Barrels) | ||||||||
| Year | Jan | Feb | Mar | Apr | May | Jun | Jul | Aug | Sep | Oct | Nov | Dec |
|---|---|---|---|---|---|---|---|---|---|---|---|---|
| 2015 | 309 | |||||||||||
| 2017 | 1,468 | 1,532 | 2,295 | 2,490 | 830 | 1,000 | ||||||
| 2018 | 1,000 | 556 | 7,259 | 524 | 4,719 | 10,441 | 3,166 | 6,073 | 5,056 | 6,766 | 3,517 | 6,045 |
| 2019 | 7,118 | 5,076 | 11,208 | 11,776 | 7,875 | 8,713 | 3,792 | 6,714 | 7,443 | 7,419 | 7,319 | 8,517 |
| 2020 | 6,809 | 8,240 | 5,630 | 5,875 | 8,223 | 10,529 | 6,210 | 5,001 | 8,267 | 7,586 | 13,051 | 17,348 |
| 2021 | 12,776 | 14,036 | 10,676 | 11,112 | 12,055 | 17,889 | 11,653 | 13,660 | 8,385 | 10,600 | 9,024 | 21,558 |
| 2022 | 16,801 | 9,872 | 4,736 | 6,507 | 8,297 | 6,448 | 6,249 | 2,949 | 12,346 | 14,260 | 18,683 | 6,349 |
| 2023 | 2,503 | 2,514 | 7,668 | 7,998 | 7,727 | 4,329 | 6,092 | 6,207 | 4,687 | 3,489 | 4,057 | 2,881 |
| 2024 | 2,986 | 4,493 | 7,865 | 9,520 | ||||||||
| - = No Data Reported; -- = Not Applicable; NA = Not Available; W = Withheld to avoid disclosure of individual company data. |
| Release Date: 6/28/2024 |
| Next Release Date: 7/31/2024 |