|
Download Data (XLS File) |
|
||||||||
|
||||||||
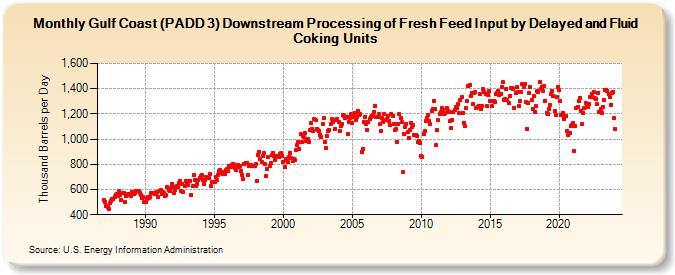
| Gulf Coast (PADD 3) Downstream Processing of Fresh Feed Input by Delayed and Fluid Coking Units (Thousand Barrels per Day) | ||||||||
| Year | Jan | Feb | Mar | Apr | May | Jun | Jul | Aug | Sep | Oct | Nov | Dec |
|---|---|---|---|---|---|---|---|---|---|---|---|---|
| 1987 | 517 | 500 | 469 | 460 | 449 | 494 | 510 | 523 | 522 | 544 | 559 | 565 |
| 1988 | 550 | 586 | 560 | 515 | 569 | 569 | 497 | 547 | 556 | 561 | 568 | 547 |
| 1989 | 582 | 567 | 565 | 575 | 592 | 588 | 585 | 574 | 560 | 532 | 538 | 499 |
| 1990 | 502 | 527 | 540 | 534 | 544 | 574 | 569 | 569 | 562 | 573 | 584 | 544 |
| 1991 | 587 | 594 | 565 | 581 | 573 | 552 | 553 | 618 | 597 | 585 | 614 | 644 |
| 1992 | 623 | 572 | 599 | 626 | 619 | 653 | 671 | 588 | 645 | 579 | 630 | 665 |
| 1993 | 642 | 639 | 664 | 671 | 554 | 627 | 713 | 676 | 630 | 647 | 673 | 694 |
| 1994 | 705 | 714 | 677 | 644 | 679 | 696 | 688 | 693 | 724 | 624 | 660 | 662 |
| 1995 | 659 | 700 | 675 | 717 | 743 | 756 | 730 | 726 | 740 | 725 | 751 | 763 |
| 1996 | 747 | 786 | 778 | 797 | 803 | 797 | 774 | 758 | 791 | 779 | 789 | 745 |
| 1997 | 715 | 681 | 801 | 813 | 814 | 715 | 785 | 794 | 794 | 785 | 783 | 789 |
| 1998 | 799 | 671 | 877 | 901 | 844 | 821 | 868 | 887 | 800 | 706 | 766 | 854 |
| 1999 | 786 | 808 | 873 | 888 | 867 | 836 | 867 | 866 | 855 | 883 | 886 | 868 |
| 2000 | 822 | 782 | 844 | 833 | 816 | 858 | 887 | 849 | 824 | 846 | 836 | 911 |
| 2001 | 950 | 976 | 919 | 1,037 | 975 | 1,026 | 1,020 | 1,045 | 982 | 1,004 | 977 | 1,074 |
| 2002 | 1,127 | 1,083 | 1,063 | 1,157 | 1,148 | 1,083 | 1,071 | 1,064 | 1,033 | 1,015 | 1,121 | 1,170 |
| 2003 | 979 | 929 | 1,027 | 1,066 | 1,076 | 1,117 | 1,156 | 1,134 | 1,148 | 1,081 | 1,150 | 1,163 |
| 2004 | 1,136 | 1,065 | 1,100 | 1,117 | 1,194 | 1,186 | 1,166 | 1,179 | 1,043 | 1,137 | 1,170 | 1,196 |
| 2005 | 1,127 | 1,175 | 1,207 | 1,150 | 1,178 | 1,226 | 1,188 | 1,199 | 901 | 919 | 1,134 | 1,179 |
| 2006 | 1,120 | 1,073 | 1,138 | 1,162 | 1,172 | 1,185 | 1,188 | 1,217 | 1,266 | 1,177 | 1,177 | 1,197 |
| 2007 | 1,117 | 1,066 | 1,164 | 1,137 | 1,203 | 1,148 | 1,159 | 1,187 | 1,146 | 1,108 | 1,203 | 1,183 |
| 2008 | 1,116 | 1,072 | 1,082 | 978 | 1,122 | 1,196 | 1,167 | 1,134 | 736 | 1,042 | 1,099 | 1,123 |
| 2009 | 1,055 | 1,011 | 1,070 | 1,128 | 1,094 | 1,110 | 1,029 | 1,036 | 1,024 | 974 | 985 | 972 |
| 2010 | 868 | 860 | 1,038 | 1,061 | 1,144 | 1,169 | 1,189 | 1,143 | 1,118 | 1,223 | 1,236 | 1,304 |
| 2011 | 1,235 | 952 | 1,075 | 1,148 | 1,203 | 1,218 | 1,243 | 1,228 | 1,203 | 1,205 | 1,245 | 1,225 |
| 2012 | 1,212 | 1,140 | 1,085 | 1,155 | 1,217 | 1,227 | 1,254 | 1,249 | 1,277 | 1,207 | 1,310 | 1,335 |
| 2013 | 1,204 | 1,130 | 1,103 | 1,246 | 1,304 | 1,419 | 1,431 | 1,345 | 1,369 | 1,280 | 1,369 | 1,375 |
| 2014 | 1,249 | 1,253 | 1,262 | 1,359 | 1,236 | 1,262 | 1,399 | 1,373 | 1,355 | 1,260 | 1,353 | 1,384 |
| 2015 | 1,306 | 1,304 | 1,259 | 1,306 | 1,298 | 1,360 | 1,366 | 1,380 | 1,351 | 1,361 | 1,416 | 1,451 |
| 2016 | 1,309 | 1,320 | 1,399 | 1,310 | 1,284 | 1,340 | 1,407 | 1,408 | 1,401 | 1,249 | 1,369 | 1,410 |
| 2017 | 1,374 | 1,264 | 1,303 | 1,376 | 1,438 | 1,412 | 1,438 | 1,292 | 1,084 | 1,283 | 1,367 | 1,411 |
| 2018 | 1,312 | 1,237 | 1,339 | 1,214 | 1,260 | 1,381 | 1,373 | 1,451 | 1,397 | 1,410 | 1,385 | 1,420 |
| 2019 | 1,301 | 1,209 | 1,196 | 1,241 | 1,273 | 1,355 | 1,385 | 1,343 | 1,219 | 1,188 | 1,337 | 1,410 |
| 2020 | 1,387 | 1,301 | 1,189 | 1,208 | 1,162 | 1,182 | 1,186 | 1,061 | 1,036 | 1,047 | 1,102 | 1,115 |
| 2021 | 1,124 | 905 | 1,103 | 1,250 | 1,257 | 1,304 | 1,328 | 1,224 | 1,122 | 1,206 | 1,244 | 1,290 |
| 2022 | 1,260 | 1,253 | 1,280 | 1,332 | 1,336 | 1,355 | 1,375 | 1,325 | 1,321 | 1,276 | 1,368 | 1,215 |
| 2023 | 1,239 | 1,211 | 1,258 | 1,307 | 1,387 | 1,393 | 1,384 | 1,355 | 1,333 | 1,273 | 1,367 | 1,377 |
| 2024 | 1,167 | |||||||||||
| - = No Data Reported; -- = Not Applicable; NA = Not Available; W = Withheld to avoid disclosure of individual company data. |
| Release Date: 3/29/2024 |
| Next Release Date: 4/30/2024 |