|
Download Data (XLS File) |
|
||||||||
|
||||||||
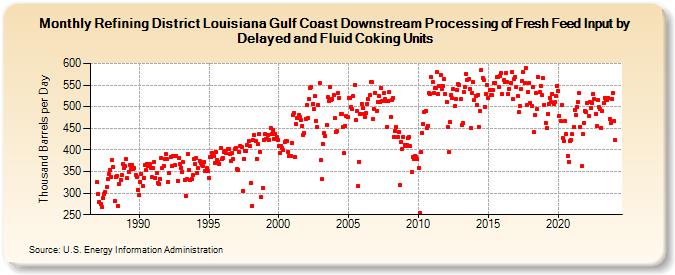
| Refining District Louisiana Gulf Coast Downstream Processing of Fresh Feed Input by Delayed and Fluid Coking Units (Thousand Barrels per Day) | ||||||||
| Year | Jan | Feb | Mar | Apr | May | Jun | Jul | Aug | Sep | Oct | Nov | Dec |
|---|---|---|---|---|---|---|---|---|---|---|---|---|
| 1987 | 325 | 298 | 280 | 275 | 267 | 288 | 297 | 302 | 313 | 332 | 345 | 354 |
| 1988 | 337 | 376 | 361 | 282 | 338 | 340 | 271 | 322 | 331 | 343 | 367 | 357 |
| 1989 | 362 | 378 | 334 | 349 | 366 | 355 | 365 | 355 | 357 | 342 | 337 | 308 |
| 1990 | 296 | 326 | 345 | 317 | 335 | 364 | 353 | 367 | 363 | 368 | 358 | 337 |
| 1991 | 357 | 373 | 336 | 346 | 324 | 321 | 332 | 382 | 359 | 363 | 378 | 390 |
| 1992 | 378 | 326 | 347 | 384 | 362 | 387 | 385 | 364 | 386 | 329 | 382 | 367 |
| 1993 | 359 | 349 | 371 | 330 | 294 | 332 | 390 | 354 | 330 | 332 | 342 | 378 |
| 1994 | 368 | 381 | 347 | 358 | 375 | 369 | 366 | 363 | 373 | 351 | 357 | 352 |
| 1995 | 336 | 384 | 384 | 393 | 386 | 370 | 396 | 376 | 372 | 367 | 404 | 379 |
| 1996 | 382 | 394 | 397 | 392 | 403 | 402 | 390 | 374 | 392 | 378 | 401 | 404 |
| 1997 | 356 | 354 | 394 | 410 | 407 | 306 | 378 | 398 | 398 | 411 | 420 | 409 |
| 1998 | 323 | 271 | 424 | 434 | 420 | 380 | 413 | 437 | 396 | 290 | 312 | 423 |
| 1999 | 436 | 426 | 425 | 434 | 424 | 450 | 437 | 446 | 426 | 437 | 430 | 424 |
| 2000 | 408 | 392 | 410 | 404 | 399 | 419 | 421 | 420 | 396 | 387 | 386 | 416 |
| 2001 | 480 | 486 | 384 | 459 | 473 | 481 | 476 | 469 | 456 | 435 | 438 | 472 |
| 2002 | 503 | 473 | 518 | 543 | 545 | 506 | 495 | 524 | 468 | 453 | 504 | 555 |
| 2003 | 376 | 332 | 414 | 438 | 432 | 457 | 522 | 513 | 545 | 516 | 517 | 528 |
| 2004 | 473 | 442 | 443 | 531 | 521 | 483 | 482 | 454 | 392 | 456 | 479 | 476 |
| 2005 | 521 | 521 | 499 | 495 | 524 | 551 | 469 | 490 | 317 | 373 | 484 | 507 |
| 2006 | 498 | 484 | 477 | 485 | 507 | 517 | 527 | 558 | 556 | 472 | 494 | 532 |
| 2007 | 491 | 512 | 524 | 512 | 544 | 514 | 531 | 517 | 513 | 453 | 513 | 533 |
| 2008 | 476 | 516 | 521 | 430 | 444 | 453 | 431 | 441 | 318 | 419 | 403 | 430 |
| 2009 | 412 | 409 | 411 | 427 | 430 | 408 | 349 | 383 | 379 | 385 | 384 | 378 |
| 2010 | 358 | 255 | 394 | 440 | 461 | 487 | 491 | 450 | 456 | 531 | 530 | 568 |
| 2011 | 556 | 531 | 543 | 544 | 580 | 529 | 549 | 574 | 540 | 548 | 563 | 530 |
| 2012 | 511 | 452 | 394 | 465 | 526 | 519 | 540 | 501 | 518 | 538 | 552 | 550 |
| 2013 | 517 | 457 | 462 | 535 | 545 | 576 | 562 | 564 | 541 | 450 | 531 | 557 |
| 2014 | 516 | 525 | 505 | 528 | 454 | 489 | 586 | 567 | 561 | 500 | 529 | 551 |
| 2015 | 521 | 538 | 526 | 527 | 538 | 555 | 555 | 568 | 568 | 546 | 572 | 578 |
| 2016 | 529 | 561 | 556 | 579 | 557 | 530 | 542 | 555 | 580 | 517 | 563 | 569 |
| 2017 | 546 | 524 | 487 | 501 | 542 | 560 | 581 | 554 | 590 | 504 | 533 | 555 |
| 2018 | 509 | 502 | 545 | 441 | 481 | 531 | 494 | 568 | 533 | 549 | 526 | 566 |
| 2019 | 505 | 463 | 450 | 484 | 507 | 521 | 510 | 530 | 507 | 510 | 525 | 548 |
| 2020 | 537 | 479 | 467 | 504 | 428 | 420 | 466 | 437 | 386 | 373 | 420 | 424 |
| 2021 | 436 | 453 | 493 | 481 | 499 | 511 | 531 | 454 | 362 | 437 | 463 | 490 |
| 2022 | 488 | 508 | 479 | 511 | 497 | 509 | 530 | 518 | 483 | 455 | 516 | 499 |
| 2023 | 495 | 451 | 489 | 508 | 520 | 515 | 516 | 521 | 471 | 462 | 518 | 532 |
| 2024 | 467 | |||||||||||
| - = No Data Reported; -- = Not Applicable; NA = Not Available; W = Withheld to avoid disclosure of individual company data. |
| Release Date: 3/29/2024 |
| Next Release Date: 4/30/2024 |