|
Download Data (XLS File) |
|
||||||||
|
||||||||
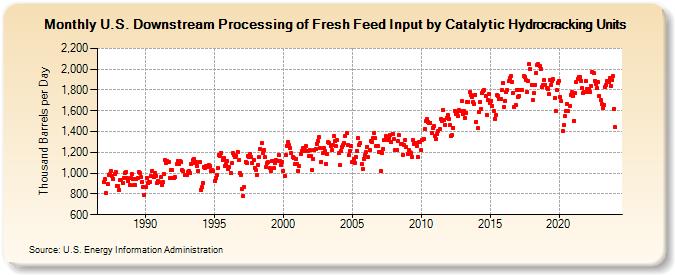
| U.S. Downstream Processing of Fresh Feed Input by Catalytic Hydrocracking Units (Thousand Barrels per Day) | ||||||||
| Year | Jan | Feb | Mar | Apr | May | Jun | Jul | Aug | Sep | Oct | Nov | Dec |
|---|---|---|---|---|---|---|---|---|---|---|---|---|
| 1987 | 916 | 940 | 806 | 893 | 986 | 996 | 1,016 | 974 | 946 | 994 | 1,007 | 880 |
| 1988 | 874 | 840 | 935 | 932 | 904 | 949 | 1,001 | 1,012 | 951 | 921 | 887 | 953 |
| 1989 | 994 | 946 | 885 | 884 | 939 | 957 | 1,009 | 1,001 | 959 | 915 | 863 | 793 |
| 1990 | 866 | 949 | 902 | 918 | 913 | 968 | 1,025 | 962 | 997 | 972 | 906 | 920 |
| 1991 | 916 | 959 | 887 | 912 | 993 | 1,127 | 1,093 | 1,121 | 1,107 | 951 | 1,026 | 1,028 |
| 1992 | 950 | 951 | 958 | 1,085 | 1,118 | 1,086 | 1,114 | 1,107 | 1,029 | 1,019 | 982 | 986 |
| 1993 | 979 | 1,013 | 1,022 | 999 | 1,086 | 1,124 | 1,137 | 1,097 | 1,109 | 1,065 | 1,023 | 1,110 |
| 1994 | 839 | 863 | 905 | 1,060 | 1,054 | 1,070 | 1,062 | 1,076 | 1,069 | 1,019 | 1,030 | 1,018 |
| 1995 | 929 | 956 | 984 | 1,045 | 1,173 | 1,161 | 1,198 | 1,128 | 1,149 | 1,070 | 1,084 | 1,116 |
| 1996 | 1,035 | 1,059 | 1,006 | 1,095 | 1,191 | 1,173 | 1,151 | 1,162 | 1,207 | 1,124 | 997 | 985 |
| 1997 | 845 | 778 | 866 | 1,110 | 1,095 | 1,166 | 1,160 | 1,184 | 1,155 | 1,100 | 1,129 | 1,054 |
| 1998 | 1,029 | 980 | 1,083 | 1,157 | 1,234 | 1,290 | 1,191 | 1,223 | 1,152 | 1,062 | 1,093 | 1,103 |
| 1999 | 1,045 | 1,017 | 1,115 | 1,120 | 1,045 | 1,098 | 1,122 | 1,115 | 1,175 | 1,113 | 1,079 | 1,110 |
| 2000 | 1,022 | 971 | 1,174 | 1,264 | 1,300 | 1,269 | 1,240 | 1,193 | 1,155 | 1,143 | 1,088 | 1,138 |
| 2001 | 1,090 | 1,023 | 1,068 | 1,181 | 1,216 | 1,242 | 1,216 | 1,220 | 1,258 | 1,213 | 1,162 | 1,222 |
| 2002 | 1,164 | 1,032 | 1,136 | 1,222 | 1,228 | 1,284 | 1,308 | 1,345 | 1,244 | 1,111 | 1,191 | 1,237 |
| 2003 | 1,215 | 1,092 | 1,187 | 1,296 | 1,292 | 1,265 | 1,219 | 1,271 | 1,355 | 1,306 | 1,257 | 1,314 |
| 2004 | 1,190 | 1,078 | 1,216 | 1,251 | 1,269 | 1,286 | 1,358 | 1,383 | 1,270 | 1,171 | 1,217 | 1,262 |
| 2005 | 1,108 | 1,137 | 1,100 | 1,160 | 1,216 | 1,335 | 1,272 | 1,287 | 1,091 | 1,042 | 1,139 | 1,171 |
| 2006 | 1,200 | 1,255 | 1,151 | 1,223 | 1,310 | 1,300 | 1,335 | 1,386 | 1,334 | 1,259 | 1,260 | 1,204 |
| 2007 | 1,205 | 1,018 | 1,195 | 1,235 | 1,321 | 1,354 | 1,334 | 1,321 | 1,337 | 1,369 | 1,299 | 1,381 |
| 2008 | 1,326 | 1,220 | 1,223 | 1,219 | 1,308 | 1,363 | 1,284 | 1,284 | 1,179 | 1,273 | 1,318 | 1,249 |
| 2009 | 1,188 | 1,227 | 1,199 | 1,197 | 1,158 | 1,314 | 1,283 | 1,290 | 1,265 | 1,158 | 1,295 | 1,298 |
| 2010 | 1,220 | 1,321 | 1,329 | 1,423 | 1,501 | 1,520 | 1,495 | 1,484 | 1,485 | 1,387 | 1,438 | 1,451 |
| 2011 | 1,355 | 1,326 | 1,375 | 1,408 | 1,421 | 1,520 | 1,505 | 1,609 | 1,510 | 1,465 | 1,535 | 1,560 |
| 2012 | 1,523 | 1,460 | 1,360 | 1,367 | 1,437 | 1,602 | 1,568 | 1,580 | 1,545 | 1,605 | 1,601 | 1,690 |
| 2013 | 1,573 | 1,599 | 1,532 | 1,579 | 1,688 | 1,689 | 1,778 | 1,753 | 1,728 | 1,686 | 1,666 | 1,756 |
| 2014 | 1,493 | 1,431 | 1,586 | 1,681 | 1,617 | 1,771 | 1,793 | 1,804 | 1,742 | 1,559 | 1,699 | 1,762 |
| 2015 | 1,672 | 1,698 | 1,648 | 1,595 | 1,524 | 1,562 | 1,752 | 1,746 | 1,716 | 1,714 | 1,799 | 1,864 |
| 2016 | 1,639 | 1,696 | 1,778 | 1,802 | 1,885 | 1,911 | 1,934 | 1,881 | 1,771 | 1,640 | 1,655 | 1,804 |
| 2017 | 1,736 | 1,742 | 1,801 | 1,799 | 1,796 | 1,934 | 1,929 | 1,895 | 1,782 | 1,884 | 2,046 | 1,997 |
| 2018 | 1,852 | 1,701 | 1,769 | 1,852 | 1,964 | 2,043 | 2,049 | 2,026 | 2,002 | 1,827 | 1,849 | 1,894 |
| 2019 | 1,847 | 1,820 | 1,814 | 1,758 | 1,897 | 1,850 | 1,887 | 1,903 | 1,722 | 1,599 | 1,796 | 1,869 |
| 2020 | 1,887 | 1,737 | 1,691 | 1,406 | 1,460 | 1,547 | 1,598 | 1,665 | 1,593 | 1,649 | 1,756 | 1,776 |
| 2021 | 1,745 | 1,504 | 1,773 | 1,879 | 1,904 | 1,924 | 1,929 | 1,891 | 1,817 | 1,772 | 1,778 | 1,883 |
| 2022 | 1,808 | 1,779 | 1,810 | 1,785 | 1,842 | 1,974 | 1,968 | 1,891 | 1,856 | 1,821 | 1,873 | 1,743 |
| 2023 | 1,699 | 1,664 | 1,625 | 1,660 | 1,825 | 1,852 | 1,891 | 1,877 | 1,911 | 1,841 | 1,896 | 1,934 |
| 2024 | 1,621 | |||||||||||
| - = No Data Reported; -- = Not Applicable; NA = Not Available; W = Withheld to avoid disclosure of individual company data. |
| Release Date: 3/29/2024 |
| Next Release Date: 4/30/2024 |