|
Download Data (XLS File) |
|
||||||||
|
||||||||
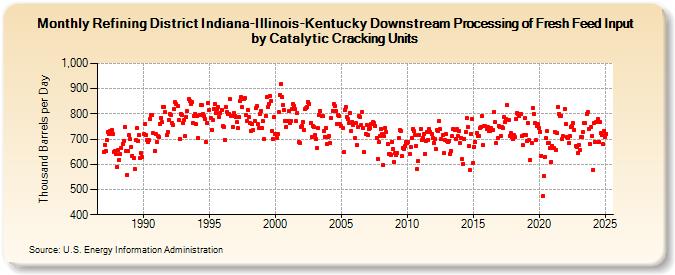
| Refining District Indiana-Illinois-Kentucky Downstream Processing of Fresh Feed Input by Catalytic Cracking Units (Thousand Barrels per Day) | ||||||||
| Year | Jan | Feb | Mar | Apr | May | Jun | Jul | Aug | Sep | Oct | Nov | Dec |
|---|---|---|---|---|---|---|---|---|---|---|---|---|
| 1987 | 650 | 678 | 653 | 695 | 727 | 722 | 731 | 736 | 722 | 649 | 651 | 639 |
| 1988 | 591 | 656 | 619 | 639 | 665 | 682 | 693 | 749 | 653 | 559 | 652 | 715 |
| 1989 | 699 | 670 | 634 | 624 | 582 | 695 | 743 | 693 | 716 | 625 | 644 | 628 |
| 1990 | 719 | 759 | 716 | 695 | 688 | 695 | 781 | 794 | 796 | 723 | 654 | 719 |
| 1991 | 690 | 712 | 708 | 760 | 785 | 766 | 829 | 827 | 806 | 715 | 728 | 776 |
| 1992 | 798 | 797 | 763 | 755 | 820 | 846 | 839 | 830 | 774 | 702 | 801 | 797 |
| 1993 | 764 | 776 | 712 | 788 | 810 | 858 | 852 | 841 | 846 | 764 | 793 | 801 |
| 1994 | 758 | 791 | 705 | 796 | 836 | 834 | 800 | 791 | 779 | 687 | 764 | 842 |
| 1995 | 817 | 782 | 737 | 775 | 820 | 841 | 805 | 818 | 829 | 788 | 802 | 815 |
| 1996 | 750 | 749 | 698 | 829 | 807 | 800 | 801 | 859 | 792 | 747 | 804 | 793 |
| 1997 | 788 | 766 | 743 | 786 | 851 | 867 | 826 | 861 | 862 | 794 | 772 | 817 |
| 1998 | 788 | 763 | 733 | 760 | 737 | 773 | 822 | 830 | 758 | 743 | 800 | 813 |
| 1999 | 743 | 770 | 700 | 793 | 867 | 827 | 841 | 871 | 852 | 733 | 699 | 786 |
| 2000 | 719 | 706 | 720 | 806 | 876 | 918 | 868 | 835 | 815 | 773 | 749 | 773 |
| 2001 | 810 | 763 | 770 | 819 | 839 | 833 | 818 | 770 | 804 | 687 | 684 | 749 |
| 2002 | 752 | 768 | 738 | 819 | 822 | 829 | 849 | 841 | 764 | 708 | 752 | 748 |
| 2003 | 718 | 701 | 666 | 743 | 794 | 811 | 792 | 791 | 731 | 710 | 746 | 680 |
| 2004 | 709 | 712 | 685 | 785 | 812 | 839 | 831 | 810 | 761 | 797 | 791 | 758 |
| 2005 | 751 | 746 | 647 | 815 | 828 | 788 | 778 | 762 | 804 | 733 | 769 | 755 |
| 2006 | 705 | 762 | 676 | 747 | 791 | 789 | 756 | 808 | 743 | 648 | 721 | 756 |
| 2007 | 715 | 741 | 745 | 759 | 759 | 768 | 763 | 751 | 706 | 622 | 688 | 712 |
| 2008 | 741 | 722 | 597 | 711 | 745 | 729 | 679 | 641 | 640 | 638 | 689 | 660 |
| 2009 | 611 | 646 | 637 | 646 | 705 | 736 | 734 | 631 | 666 | 662 | 674 | 690 |
| 2010 | 683 | 688 | 639 | 668 | 706 | 742 | 731 | 718 | 674 | 582 | 614 | 717 |
| 2011 | 742 | 696 | 706 | 721 | 642 | 694 | 730 | 698 | 739 | 728 | 722 | 706 |
| 2012 | 685 | 700 | 662 | 737 | 731 | 771 | 740 | 700 | 717 | 644 | 695 | 720 |
| 2013 | 694 | 689 | 694 | 642 | 652 | 711 | 741 | 735 | 701 | 739 | 712 | 731 |
| 2014 | 684 | 705 | 620 | 603 | 701 | 728 | 782 | 748 | 674 | 577 | 719 | 779 |
| 2015 | 604 | 670 | 689 | 725 | 711 | 712 | 743 | 749 | 790 | 676 | 752 | 750 |
| 2016 | 741 | 748 | 733 | 734 | 743 | 738 | 738 | 809 | 767 | 683 | 704 | 753 |
| 2017 | 748 | 712 | 748 | 743 | 787 | 766 | 778 | 834 | 777 | 713 | 723 | 707 |
| 2018 | 699 | 715 | 708 | 780 | 802 | 800 | 790 | 800 | 711 | 675 | 715 | 783 |
| 2019 | 717 | 693 | 762 | 695 | 618 | 686 | 825 | 801 | 763 | 697 | 752 | 759 |
| 2020 | 744 | 730 | 634 | 474 | 553 | 627 | 703 | 731 | 685 | 683 | 665 | 611 |
| 2021 | 674 | 665 | 730 | 658 | 723 | 828 | 801 | 791 | 793 | 701 | 711 | 820 |
| 2022 | 759 | 709 | 706 | 683 | 711 | 748 | 752 | 763 | 737 | 672 | 669 | 643 |
| 2023 | 684 | 657 | 707 | 709 | 727 | 762 | 762 | 801 | 806 | 741 | 681 | 748 |
| 2024 | 714 | |||||||||||
| - = No Data Reported; -- = Not Applicable; NA = Not Available; W = Withheld to avoid disclosure of individual company data. |
| Release Date: 3/29/2024 |
| Next Release Date: 4/30/2024 |