|
Download Data (XLS File) |
|
||||||||
|
||||||||
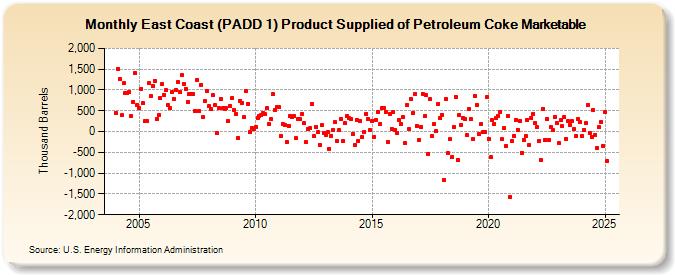
| East Coast (PADD 1) Product Supplied of Petroleum Coke Marketable (Thousand Barrels) | ||||||||
| Year | Jan | Feb | Mar | Apr | May | Jun | Jul | Aug | Sep | Oct | Nov | Dec |
|---|---|---|---|---|---|---|---|---|---|---|---|---|
| 2004 | 456 | 1,515 | 1,257 | 391 | 1,156 | 916 | 916 | 955 | 369 | 720 | 1,404 | 644 |
| 2005 | 563 | 1,031 | 678 | 247 | 260 | 1,161 | 850 | 1,105 | 1,227 | 307 | 390 | 804 |
| 2006 | 1,136 | 881 | 993 | 629 | 556 | 940 | 791 | 996 | 1,188 | 961 | 1,358 | 1,145 |
| 2007 | 1,030 | 716 | 897 | 892 | 914 | 484 | 1,247 | 484 | 1,128 | 349 | 725 | 978 |
| 2008 | 609 | 537 | 872 | 628 | -39 | 557 | 786 | 558 | 545 | 557 | 251 | 612 |
| 2009 | 808 | 522 | 425 | -148 | 744 | 696 | 344 | 981 | 670 | -17 | 82 | 63 |
| 2010 | 100 | 326 | 374 | 407 | 442 | 415 | 557 | 190 | 297 | 895 | 511 | 593 |
| 2011 | 584 | -104 | 193 | 161 | -247 | 134 | 381 | 347 | 364 | -162 | 306 | 290 |
| 2012 | 427 | 196 | -255 | 56 | 80 | 664 | -113 | 119 | -14 | -312 | 149 | -33 |
| 2013 | -89 | -14 | -412 | -106 | 33 | 225 | -222 | 26 | 312 | -230 | 201 | 383 |
| 2014 | 315 | 299 | -54 | -328 | 287 | -216 | 251 | -135 | -2 | 431 | 291 | 35 |
| 2015 | 257 | -123 | 276 | 471 | 173 | 559 | 561 | 482 | -255 | 422 | 69 | 463 |
| 2016 | 38 | -37 | 270 | 173 | 341 | -283 | 640 | 55 | 784 | 443 | 909 | 144 |
| 2017 | -196 | 106 | 915 | 364 | 877 | -539 | 776 | -108 | 172 | 2 | 674 | 317 |
| 2018 | 410 | -1,159 | 784 | -511 | -189 | -619 | 110 | 837 | -678 | 402 | 169 | 320 |
| 2019 | 297 | -89 | 537 | 295 | -185 | 859 | 640 | -65 | 175 | -19 | 1 | 820 |
| 2020 | -170 | -620 | 273 | 192 | 330 | 370 | 475 | -184 | 80 | -336 | 363 | -1,564 |
| 2021 | -234 | -99 | 278 | 44 | 246 | -510 | -203 | -110 | 282 | -328 | 320 | 433 |
| 2022 | 194 | 98 | -219 | -692 | 551 | -211 | 312 | -196 | 108 | 31 | 360 | 205 |
| 2023 | -287 | 277 | 128 | 358 | -173 | 243 | 167 | 242 | 59 | -277 | 474 | 372 |
| 2024 | -100 | |||||||||||
| - = No Data Reported; -- = Not Applicable; NA = Not Available; W = Withheld to avoid disclosure of individual company data. |
| Release Date: 3/29/2024 |
| Next Release Date: 4/30/2024 |