|
Download Data (XLS File) |
|
||||||||
|
||||||||
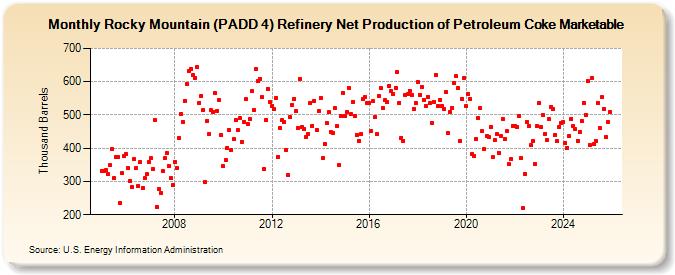
| Rocky Mountain (PADD 4) Refinery Net Production of Petroleum Coke Marketable (Thousand Barrels) | ||||||||
| Year | Jan | Feb | Mar | Apr | May | Jun | Jul | Aug | Sep | Oct | Nov | Dec |
|---|---|---|---|---|---|---|---|---|---|---|---|---|
| 2005 | 332 | 332 | 334 | 321 | 348 | 398 | 310 | 374 | 373 | 235 | 324 | 378 |
| 2006 | 383 | 339 | 302 | 284 | 366 | 340 | 287 | 357 | 279 | 310 | 322 | 359 |
| 2007 | 369 | 338 | 485 | 224 | 277 | 266 | 331 | 370 | 385 | 347 | 309 | 290 |
| 2008 | 359 | 341 | 430 | 504 | 479 | 543 | 593 | 633 | 638 | 620 | 611 | 644 |
| 2009 | 537 | 557 | 515 | 299 | 481 | 443 | 514 | 509 | 565 | 513 | 545 | 440 |
| 2010 | 345 | 365 | 402 | 455 | 394 | 427 | 485 | 455 | 490 | 420 | 480 | 547 |
| 2011 | 473 | 488 | 571 | 515 | 637 | 601 | 609 | 554 | 338 | 486 | 579 | 539 |
| 2012 | 527 | 517 | 551 | 375 | 460 | 484 | 479 | 395 | 319 | 493 | 531 | 549 |
| 2013 | 511 | 462 | 608 | 464 | 458 | 435 | 444 | 537 | 468 | 543 | 456 | 511 |
| 2014 | 551 | 369 | 412 | 476 | 508 | 450 | 447 | 520 | 466 | 349 | 497 | 566 |
| 2015 | 496 | 510 | 582 | 502 | 540 | 496 | 441 | 423 | 443 | 549 | 554 | 535 |
| 2016 | 535 | 452 | 541 | 493 | 442 | 557 | 580 | 520 | 544 | 538 | 588 | 571 |
| 2017 | 563 | 582 | 629 | 536 | 431 | 423 | 561 | 562 | 572 | 559 | 519 | 536 |
| 2018 | 599 | 561 | 584 | 545 | 528 | 555 | 536 | 476 | 540 | 621 | 528 | 545 |
| 2019 | 527 | 517 | 569 | 447 | 510 | 522 | 595 | 616 | 581 | 421 | 549 | 611 |
| 2020 | 526 | 563 | 549 | 383 | 377 | 428 | 491 | 520 | 452 | 397 | 437 | 434 |
| 2021 | 463 | 372 | 424 | 442 | 387 | 437 | 488 | 427 | 451 | 351 | 366 | 467 |
| 2022 | 468 | 464 | 498 | 370 | 219 | 323 | 479 | 467 | 409 | 421 | 352 | 466 |
| 2023 | 536 | 502 | 501 | 444 | 424 | 489 | 524 | 517 | 439 | 422 | 465 | 477 |
| 2024 | 478 | |||||||||||
| - = No Data Reported; -- = Not Applicable; NA = Not Available; W = Withheld to avoid disclosure of individual company data. |
| Release Date: 3/29/2024 |
| Next Release Date: 4/30/2024 |