|
Download Data (XLS File) |
|
||||||||
|
||||||||
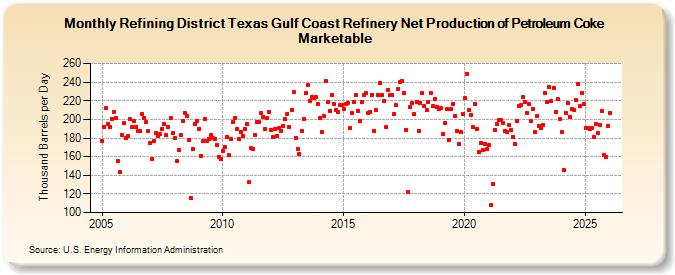
| Refining District Texas Gulf Coast Refinery Net Production of Petroleum Coke Marketable (Thousand Barrels per Day) | ||||||||
| Year | Jan | Feb | Mar | Apr | May | Jun | Jul | Aug | Sep | Oct | Nov | Dec |
|---|---|---|---|---|---|---|---|---|---|---|---|---|
| 2005 | 177 | 192 | 212 | 195 | 192 | 200 | 208 | 202 | 155 | 143 | 183 | 196 |
| 2006 | 180 | 182 | 200 | 192 | 198 | 192 | 187 | 187 | 206 | 202 | 197 | 188 |
| 2007 | 175 | 158 | 177 | 185 | 182 | 184 | 190 | 195 | 183 | 192 | 201 | 185 |
| 2008 | 180 | 155 | 167 | 183 | 198 | 207 | 204 | 178 | 116 | 168 | 195 | 198 |
| 2009 | 190 | 161 | 177 | 200 | 177 | 179 | 183 | 180 | 179 | 173 | 160 | 158 |
| 2010 | 166 | 170 | 181 | 162 | 179 | 197 | 202 | 190 | 179 | 186 | 182 | 190 |
| 2011 | 195 | 133 | 169 | 168 | 183 | 197 | 197 | 207 | 203 | 190 | 201 | 208 |
| 2012 | 189 | 181 | 190 | 182 | 191 | 188 | 193 | 200 | 206 | 192 | 210 | 229 |
| 2013 | 180 | 168 | 163 | 187 | 200 | 228 | 237 | 220 | 224 | 223 | 224 | 217 |
| 2014 | 201 | 186 | 204 | 241 | 219 | 209 | 226 | 217 | 210 | 208 | 215 | 215 |
| 2015 | 211 | 217 | 218 | 191 | 207 | 219 | 226 | 209 | 198 | 219 | 226 | 228 |
| 2016 | 207 | 208 | 226 | 188 | 210 | 226 | 239 | 226 | 220 | 192 | 232 | 226 |
| 2017 | 226 | 206 | 215 | 233 | 240 | 241 | 228 | 189 | 122 | 213 | 218 | 206 |
| 2018 | 219 | 188 | 218 | 228 | 214 | 210 | 219 | 228 | 214 | 222 | 213 | 211 |
| 2019 | 212 | 184 | 196 | 211 | 178 | 211 | 216 | 204 | 188 | 174 | 186 | 206 |
| 2020 | 223 | 249 | 210 | 205 | 192 | 217 | 190 | 165 | 175 | 167 | 174 | 168 |
| 2021 | 172 | 108 | 131 | 189 | 195 | 199 | 199 | 196 | 188 | 186 | 194 | 189 |
| 2022 | 181 | 174 | 198 | 214 | 215 | 224 | 219 | 207 | 216 | 198 | 211 | 186 |
| 2023 | 204 | 193 | 191 | 194 | 228 | 219 | 235 | 220 | 234 | 208 | 222 | 200 |
| 2024 | 186 | 146 | 207 | 218 | 203 | 211 | ||||||
| - = No Data Reported; -- = Not Applicable; NA = Not Available; W = Withheld to avoid disclosure of individual company data. |
| Release Date: 8/30/2024 |
| Next Release Date: 9/30/2024 |