|
Download Data (XLS File) |
|
||||||||
|
||||||||
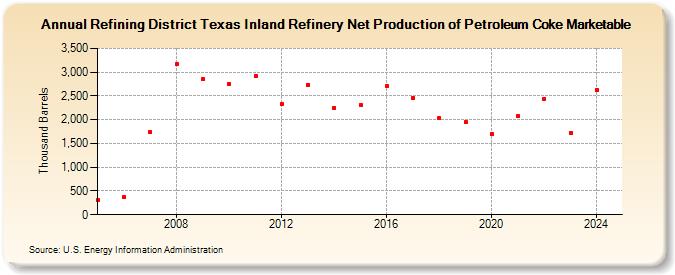
| Refining District Texas Inland Refinery Net Production of Petroleum Coke Marketable (Thousand Barrels) | ||||||||
| Decade | Year-0 | Year-1 | Year-2 | Year-3 | Year-4 | Year-5 | Year-6 | Year-7 | Year-8 | Year-9 |
|---|---|---|---|---|---|---|---|---|---|---|
| 2000's | 318 | 368 | 1,736 | 3,174 | 2,849 | |||||
| 2010's | 2,754 | 2,927 | 2,335 | 2,740 | 2,253 | 2,309 | 2,702 | 2,464 | 2,030 | 1,953 |
| 2020's | 1,708 | 2,087 | 2,440 | 1,727 |
| - = No Data Reported; -- = Not Applicable; NA = Not Available; W = Withheld to avoid disclosure of individual company data. |
| Release Date: 3/29/2024 |
| Next Release Date: 8/30/2024 |