|
Download Data (XLS File) |
|
||||||||
|
||||||||
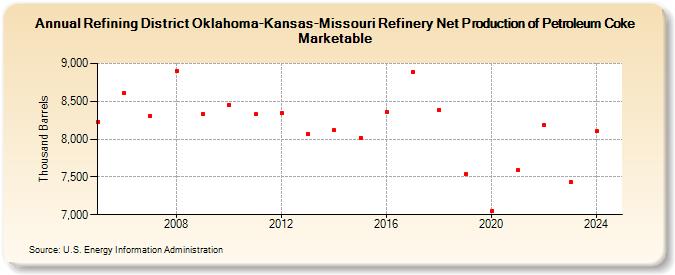
| Refining District Oklahoma-Kansas-Missouri Refinery Net Production of Petroleum Coke Marketable (Thousand Barrels) | ||||||||
| Decade | Year-0 | Year-1 | Year-2 | Year-3 | Year-4 | Year-5 | Year-6 | Year-7 | Year-8 | Year-9 |
|---|---|---|---|---|---|---|---|---|---|---|
| 2000's | 8,231 | 8,610 | 8,307 | 8,906 | 8,332 | |||||
| 2010's | 8,453 | 8,327 | 8,343 | 8,071 | 8,116 | 8,019 | 8,360 | 8,889 | 8,386 | 7,535 |
| 2020's | 7,049 | 7,586 | 8,186 | 7,428 |
| - = No Data Reported; -- = Not Applicable; NA = Not Available; W = Withheld to avoid disclosure of individual company data. |
| Release Date: 3/29/2024 |
| Next Release Date: 8/30/2024 |