|
Download Data (XLS File) |
|
||||||||
|
||||||||
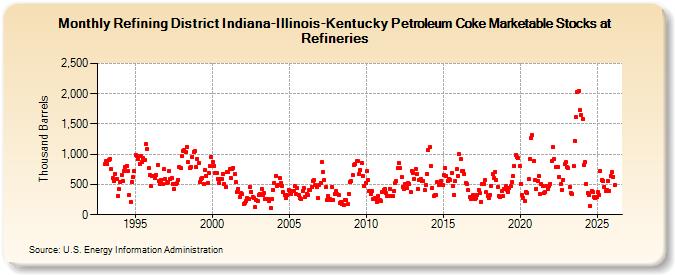
| Refining District Indiana-Illinois-Kentucky Petroleum Coke Marketable Stocks at Refineries (Thousand Barrels) | ||||||||
| Year | Jan | Feb | Mar | Apr | May | Jun | Jul | Aug | Sep | Oct | Nov | Dec |
|---|---|---|---|---|---|---|---|---|---|---|---|---|
| 1993 | 834 | 886 | 832 | 910 | 921 | 750 | 605 | 555 | 680 | 592 | 315 | 419 |
| 1994 | 545 | 660 | 557 | 719 | 783 | 811 | 726 | 327 | 208 | 541 | 617 | 730 |
| 1995 | 987 | 969 | 915 | 836 | 965 | 875 | 931 | 897 | 1,162 | 1,089 | 770 | 651 |
| 1996 | 472 | 637 | 645 | 608 | 662 | 824 | 556 | 515 | 581 | 502 | 748 | 588 |
| 1997 | 524 | 540 | 716 | 588 | 603 | 503 | 424 | 512 | 518 | 579 | 791 | 768 |
| 1998 | 972 | 1,061 | 1,068 | 1,043 | 1,125 | 869 | 777 | 795 | 961 | 1,037 | 1,056 | 782 |
| 1999 | 924 | 848 | 541 | 584 | 609 | 511 | 735 | 644 | 522 | 683 | 806 | 954 |
| 2000 | 876 | 808 | 682 | 684 | 596 | 528 | 583 | 591 | 679 | 508 | 453 | 702 |
| 2001 | 703 | 755 | 611 | 763 | 780 | 674 | 533 | 369 | 430 | 300 | 356 | 335 |
| 2002 | 184 | 193 | 233 | 272 | 264 | 458 | 382 | 289 | 275 | 123 | 238 | 226 |
| 2003 | 329 | 349 | 426 | 323 | 361 | 258 | 264 | 259 | 220 | 110 | 252 | 415 |
| 2004 | 525 | 645 | 473 | 486 | 609 | 528 | 481 | 369 | 318 | 284 | 324 | 416 |
| 2005 | 398 | 344 | 384 | 393 | 474 | 346 | 442 | 322 | 272 | 254 | 386 | 440 |
| 2006 | 295 | 350 | 318 | 408 | 415 | 455 | 553 | 567 | 488 | 452 | 276 | 492 |
| 2007 | 530 | 866 | 710 | 574 | 454 | 235 | 309 | 262 | 237 | 451 | 239 | 343 |
| 2008 | 384 | 338 | 325 | 196 | 216 | 181 | 159 | 244 | 242 | 171 | 344 | 544 |
| 2009 | 556 | 657 | 828 | 834 | 880 | 885 | 676 | 747 | 861 | 643 | 476 | 519 |
| 2010 | 717 | 571 | 385 | 346 | 385 | 262 | 272 | 268 | 206 | 313 | 249 | 222 |
| 2011 | 383 | 413 | 423 | 354 | 302 | 316 | 426 | 311 | 306 | 395 | 519 | 556 |
| 2012 | 764 | 862 | 764 | 621 | 450 | 417 | 514 | 439 | 522 | 508 | 377 | 716 |
| 2013 | 684 | 598 | 759 | 680 | 427 | 570 | 592 | 556 | 559 | 409 | 487 | 678 |
| 2014 | 1,073 | 1,112 | 807 | 445 | 309 | 323 | 321 | 541 | 499 | 527 | 564 | 489 |
| 2015 | 656 | 770 | 645 | 564 | 593 | 578 | 692 | 468 | 333 | 552 | 753 | 644 |
| 2016 | 998 | 926 | 715 | 730 | 676 | 524 | 502 | 403 | 285 | 264 | 301 | 331 |
| 2017 | 258 | 279 | 328 | 416 | 353 | 216 | 505 | 507 | 570 | 368 | 306 | 281 |
| 2018 | 327 | 479 | 665 | 604 | 711 | 568 | 466 | 311 | 290 | 391 | 307 | 430 |
| 2019 | 470 | 411 | 382 | 434 | 471 | 543 | 632 | 809 | 992 | 950 | 933 | 804 |
| 2020 | 516 | 324 | 279 | 223 | 380 | 359 | 583 | 929 | 1,263 | 1,310 | 888 | 574 |
| 2021 | 430 | 550 | 647 | 335 | 507 | 475 | 360 | 377 | 480 | 429 | 475 | 514 |
| 2022 | 885 | 1,114 | 921 | 788 | 788 | 793 | 630 | 506 | 416 | 582 | 834 | 864 |
| 2023 | 787 | 766 | 457 | 358 | 336 | 807 | 1,219 | 1,616 | 2,023 | 2,047 | 1,726 | 1,647 |
| 2024 | 1,590 | |||||||||||
| - = No Data Reported; -- = Not Applicable; NA = Not Available; W = Withheld to avoid disclosure of individual company data. |
| Release Date: 3/29/2024 |
| Next Release Date: 4/30/2024 |