|
Download Data (XLS File) |
|
||||||||
|
||||||||
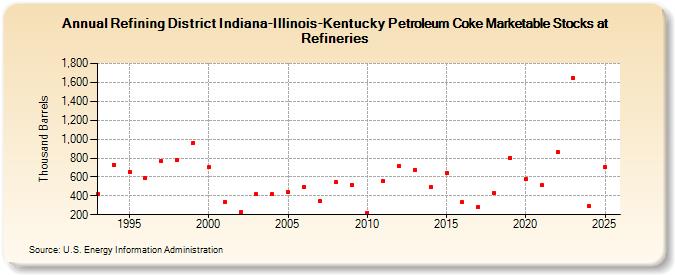
| Refining District Indiana-Illinois-Kentucky Petroleum Coke Marketable Stocks at Refineries (Thousand Barrels) | ||||||||
| Decade | Year-0 | Year-1 | Year-2 | Year-3 | Year-4 | Year-5 | Year-6 | Year-7 | Year-8 | Year-9 |
|---|---|---|---|---|---|---|---|---|---|---|
| 1990's | 419 | 730 | 651 | 588 | 768 | 782 | 954 | |||
| 2000's | 702 | 335 | 226 | 415 | 416 | 440 | 492 | 343 | 544 | 519 |
| 2010's | 222 | 556 | 716 | 678 | 489 | 644 | 331 | 281 | 430 | 804 |
| 2020's | 574 | 514 | 864 | 1,647 |
| - = No Data Reported; -- = Not Applicable; NA = Not Available; W = Withheld to avoid disclosure of individual company data. |
| Release Date: 8/30/2024 |
| Next Release Date: 8/29/2025 |