|
Download Data (XLS File) |
|
||||||||
|
||||||||
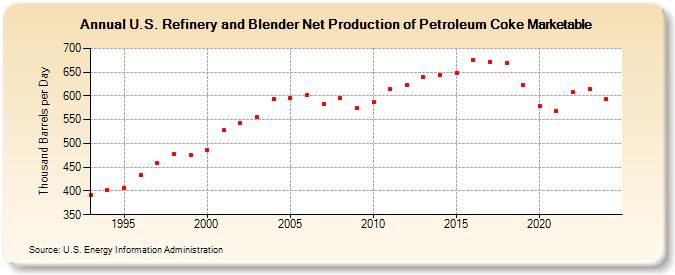
| U.S. Refinery and Blender Net Production of Petroleum Coke Marketable (Thousand Barrels per Day) | ||||||||
| Decade | Year-0 | Year-1 | Year-2 | Year-3 | Year-4 | Year-5 | Year-6 | Year-7 | Year-8 | Year-9 |
|---|---|---|---|---|---|---|---|---|---|---|
| 1990's | 392 | 401 | 407 | 434 | 458 | 477 | 475 | |||
| 2000's | 487 | 528 | 543 | 556 | 594 | 596 | 601 | 584 | 595 | 575 |
| 2010's | 587 | 615 | 622 | 640 | 645 | 649 | 676 | 672 | 670 | 623 |
| 2020's | 579 | 568 | 609 | 615 |
| - = No Data Reported; -- = Not Applicable; NA = Not Available; W = Withheld to avoid disclosure of individual company data. |
| Release Date: 3/29/2024 |
| Next Release Date: 8/30/2024 |