|
Download Data (XLS File) |
|
||||||||
|
||||||||
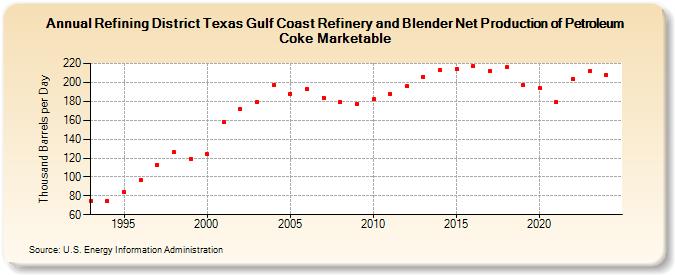
| Refining District Texas Gulf Coast Refinery and Blender Net Production of Petroleum Coke Marketable (Thousand Barrels per Day) | ||||||||
| Decade | Year-0 | Year-1 | Year-2 | Year-3 | Year-4 | Year-5 | Year-6 | Year-7 | Year-8 | Year-9 |
|---|---|---|---|---|---|---|---|---|---|---|
| 1990's | 75 | 74 | 84 | 97 | 113 | 126 | 119 | |||
| 2000's | 124 | 158 | 172 | 179 | 197 | 188 | 193 | 184 | 179 | 177 |
| 2010's | 182 | 188 | 196 | 206 | 213 | 214 | 217 | 212 | 216 | 197 |
| 2020's | 194 | 179 | 204 | 212 |
| - = No Data Reported; -- = Not Applicable; NA = Not Available; W = Withheld to avoid disclosure of individual company data. |
| Release Date: 8/30/2024 |
| Next Release Date: 8/29/2025 |