|
Download Data (XLS File) |
|
||||||||
|
||||||||
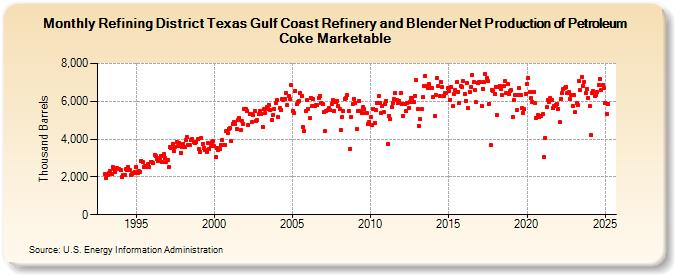
| Refining District Texas Gulf Coast Refinery and Blender Net Production of Petroleum Coke Marketable (Thousand Barrels) | ||||||||
| Year | Jan | Feb | Mar | Apr | May | Jun | Jul | Aug | Sep | Oct | Nov | Dec |
|---|---|---|---|---|---|---|---|---|---|---|---|---|
| 1993 | 2,144 | 1,940 | 2,075 | 2,205 | 2,328 | 2,139 | 2,549 | 2,397 | 2,253 | 2,491 | 2,398 | 2,416 |
| 1994 | 2,346 | 2,007 | 2,090 | 2,096 | 2,407 | 2,379 | 2,535 | 2,378 | 2,112 | 2,167 | 2,214 | 2,276 |
| 1995 | 2,515 | 2,186 | 2,294 | 2,271 | 2,847 | 2,779 | 2,549 | 2,569 | 2,538 | 2,693 | 2,549 | 2,811 |
| 1996 | 2,764 | 2,713 | 3,182 | 3,086 | 2,972 | 2,851 | 2,994 | 3,082 | 2,798 | 3,192 | 2,990 | 2,812 |
| 1997 | 2,914 | 2,507 | 3,578 | 3,527 | 3,763 | 3,362 | 3,590 | 3,861 | 3,634 | 3,802 | 3,259 | 3,577 |
| 1998 | 3,746 | 3,569 | 3,932 | 4,099 | 3,685 | 3,714 | 3,978 | 4,010 | 3,826 | 3,780 | 3,827 | 3,987 |
| 1999 | 3,486 | 3,307 | 4,054 | 3,757 | 3,530 | 3,435 | 3,324 | 3,770 | 3,502 | 3,623 | 3,845 | 3,883 |
| 2000 | 3,619 | 3,036 | 3,552 | 3,431 | 3,454 | 3,712 | 3,959 | 3,713 | 3,674 | 4,422 | 4,329 | 4,549 |
| 2001 | 4,562 | 3,904 | 4,820 | 4,918 | 4,814 | 4,546 | 5,027 | 5,095 | 4,464 | 4,978 | 4,824 | 5,605 |
| 2002 | 5,604 | 5,500 | 4,751 | 5,305 | 5,319 | 4,908 | 5,279 | 5,479 | 4,970 | 4,984 | 5,313 | 5,509 |
| 2003 | 5,350 | 4,636 | 5,606 | 5,371 | 5,673 | 5,576 | 5,826 | 5,528 | 5,027 | 5,298 | 5,615 | 5,928 |
| 2004 | 6,053 | 5,144 | 5,642 | 5,553 | 6,101 | 6,091 | 6,147 | 6,436 | 5,785 | 6,276 | 6,095 | 6,838 |
| 2005 | 5,479 | 5,385 | 6,566 | 5,835 | 5,943 | 6,012 | 6,437 | 6,272 | 4,637 | 4,447 | 5,483 | 6,064 |
| 2006 | 5,575 | 5,107 | 6,188 | 5,749 | 6,123 | 5,754 | 5,811 | 5,795 | 6,188 | 6,274 | 5,924 | 5,831 |
| 2007 | 5,431 | 4,426 | 5,499 | 5,535 | 5,644 | 5,514 | 5,882 | 6,056 | 5,495 | 5,945 | 6,022 | 5,744 |
| 2008 | 5,581 | 4,505 | 5,175 | 5,482 | 6,147 | 6,200 | 6,316 | 5,505 | 3,471 | 5,194 | 5,851 | 6,139 |
| 2009 | 5,900 | 4,521 | 5,497 | 5,996 | 5,502 | 5,382 | 5,676 | 5,592 | 5,362 | 5,367 | 4,797 | 4,895 |
| 2010 | 5,157 | 4,761 | 5,608 | 4,848 | 5,540 | 5,897 | 6,258 | 5,898 | 5,370 | 5,766 | 5,453 | 5,881 |
| 2011 | 6,030 | 3,736 | 5,240 | 5,040 | 5,680 | 5,909 | 6,116 | 6,432 | 6,078 | 5,901 | 6,034 | 6,449 |
| 2012 | 5,858 | 5,239 | 5,878 | 5,468 | 5,914 | 5,654 | 5,974 | 6,192 | 6,174 | 5,954 | 6,305 | 7,104 |
| 2013 | 5,576 | 4,715 | 5,056 | 5,598 | 6,201 | 6,827 | 7,352 | 6,818 | 6,710 | 6,901 | 6,706 | 6,725 |
| 2014 | 6,245 | 5,209 | 6,320 | 7,236 | 6,794 | 6,273 | 7,019 | 6,731 | 6,296 | 6,458 | 6,463 | 6,678 |
| 2015 | 6,549 | 6,081 | 6,764 | 5,741 | 6,412 | 6,572 | 7,006 | 6,480 | 5,931 | 6,786 | 6,770 | 7,061 |
| 2016 | 6,405 | 6,037 | 6,992 | 5,647 | 6,507 | 6,765 | 7,398 | 7,004 | 6,601 | 5,942 | 6,956 | 7,008 |
| 2017 | 7,021 | 5,755 | 6,672 | 7,001 | 7,449 | 7,230 | 7,072 | 5,874 | 3,672 | 6,610 | 6,539 | 6,379 |
| 2018 | 6,782 | 5,276 | 6,761 | 6,832 | 6,639 | 6,310 | 6,785 | 7,055 | 6,421 | 6,897 | 6,391 | 6,556 |
| 2019 | 6,583 | 5,147 | 6,061 | 6,343 | 5,518 | 6,318 | 6,705 | 6,334 | 5,640 | 5,394 | 5,571 | 6,387 |
| 2020 | 6,921 | 7,233 | 6,507 | 6,155 | 5,965 | 6,517 | 5,899 | 5,120 | 5,249 | 5,166 | 5,227 | 5,205 |
| 2021 | 5,322 | 3,033 | 4,067 | 5,683 | 6,052 | 5,971 | 6,162 | 6,090 | 5,627 | 5,753 | 5,829 | 5,858 |
| 2022 | 5,609 | 4,885 | 6,134 | 6,433 | 6,664 | 6,712 | 6,779 | 6,413 | 6,478 | 6,129 | 6,316 | 5,751 |
| 2023 | 6,316 | 5,162 | 5,921 | 5,819 | 7,060 | 6,573 | 7,360 | 6,818 | 6,933 | 6,434 | 6,660 | 6,199 |
| 2024 | 5,754 | |||||||||||
| - = No Data Reported; -- = Not Applicable; NA = Not Available; W = Withheld to avoid disclosure of individual company data. |
| Release Date: 3/29/2024 |
| Next Release Date: 4/30/2024 |