|
Download Data (XLS File) |
|
||||||||
|
||||||||
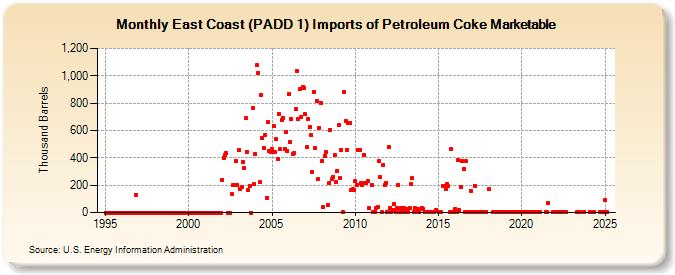
| East Coast (PADD 1) Imports of Petroleum Coke Marketable (Thousand Barrels) | ||||||||
| Year | Jan | Feb | Mar | Apr | May | Jun | Jul | Aug | Sep | Oct | Nov | Dec |
|---|---|---|---|---|---|---|---|---|---|---|---|---|
| 1995 | 0 | 0 | 0 | 0 | 0 | 0 | 0 | 0 | 0 | 0 | 0 | 0 |
| 1996 | 0 | 0 | 0 | 0 | 0 | 0 | 0 | 0 | 0 | 0 | 129 | 0 |
| 1997 | 0 | 0 | 0 | 0 | 0 | 0 | 0 | 0 | 0 | 0 | 0 | 0 |
| 1998 | 0 | 0 | 0 | 0 | 0 | 0 | 0 | 0 | 0 | 0 | 0 | 0 |
| 1999 | 0 | 0 | 0 | 0 | 0 | 0 | 0 | 0 | 0 | 0 | 0 | 0 |
| 2000 | 0 | 0 | 0 | 0 | 0 | 0 | 0 | 0 | 0 | 0 | 0 | 0 |
| 2001 | 0 | 0 | 0 | 0 | 0 | 0 | 0 | 0 | 0 | 0 | 0 | 0 |
| 2002 | 240 | 402 | 420 | 432 | 0 | 0 | 0 | 136 | 199 | 199 | 379 | 201 |
| 2003 | 459 | 174 | 188 | 371 | 326 | 691 | 444 | 165 | 195 | 0 | 765 | 207 |
| 2004 | 425 | 1,076 | 1,022 | 221 | 861 | 542 | 474 | 569 | 109 | 665 | 448 | 443 |
| 2005 | 462 | 636 | 442 | 535 | 395 | 723 | 464 | 677 | 692 | 468 | 592 | 449 |
| 2006 | 869 | 518 | 685 | 427 | 437 | 758 | 1,038 | 682 | 904 | 702 | 919 | 908 |
| 2007 | 718 | 480 | 684 | 623 | 566 | 296 | 884 | 471 | 818 | 245 | 620 | 799 |
| 2008 | 380 | 37 | 414 | 443 | 53 | 217 | 607 | 247 | 262 | 419 | 223 | 302 |
| 2009 | 641 | 249 | 458 | 1 | 878 | 671 | 456 | 655 | 658 | 168 | 169 | 162 |
| 2010 | 228 | 203 | 454 | 459 | 215 | 198 | 421 | 215 | 218 | 228 | 32 | |
| 2011 | 198 | 1 | 3 | 35 | 37 | 376 | 259 | 2 | 351 | 200 | 216 | 1 |
| 2012 | 478 | 32 | 6 | 18 | 62 | 1 | 30 | 205 | 1 | 30 | 1 | 30 |
| 2013 | 1 | 29 | 2 | 30 | 209 | 252 | 4 | 30 | 2 | 28 | 2 | |
| 2014 | 32 | 27 | 1 | 1 | 2 | 2 | 2 | 2 | 1 | 1 | 20 | |
| 2015 | 1 | 1 | 1 | 195 | 194 | 174 | 212 | 192 | 2 | 464 | 1 | 1 |
| 2016 | 29 | 7 | 384 | 19 | 187 | 378 | 322 | 1 | 375 | 1 | 1 | 158 |
| 2017 | 3 | 1 | 195 | 4 | 2 | 3 | 1 | 4 | 3 | 1 | ||
| 2018 | 170 | 1 | 4 | 3 | 3 | 3 | 2 | 3 | 1 | 3 | ||
| 2019 | 6 | 4 | 7 | 3 | 1 | 1 | 1 | 1 | 1 | 1 | 2 | |
| 2020 | 1 | 2 | 1 | 2 | 2 | 3 | 7 | 4 | 7 | 6 | 2 | |
| 2021 | 6 | 1 | 1 | 1 | 69 | 1 | 4 | |||||
| 2022 | 4 | 3 | 1 | 1 | 1 | 1 | 1 | |||||
| 2023 | 1 | 1 | 1 | 1 | ||||||||
| - = No Data Reported; -- = Not Applicable; NA = Not Available; W = Withheld to avoid disclosure of individual company data. |
| Release Date: 3/29/2024 |
| Next Release Date: 4/30/2024 |