|
Download Data (XLS File) |
|
||||||||
|
||||||||
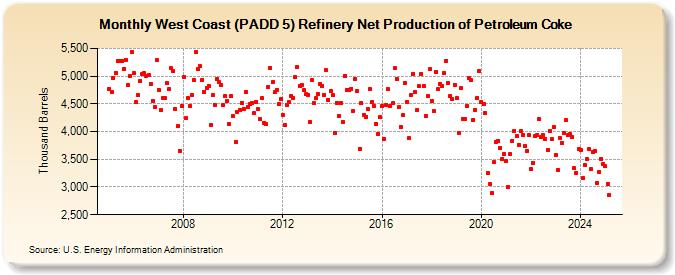
| West Coast (PADD 5) Refinery Net Production of Petroleum Coke (Thousand Barrels) | ||||||||
| Year | Jan | Feb | Mar | Apr | May | Jun | Jul | Aug | Sep | Oct | Nov | Dec |
|---|---|---|---|---|---|---|---|---|---|---|---|---|
| 2005 | 4,764 | 4,707 | 4,971 | 5,065 | 5,269 | 5,280 | 5,265 | 5,136 | 5,299 | 4,838 | 4,995 | 5,428 |
| 2006 | 5,051 | 4,532 | 4,657 | 4,912 | 5,046 | 5,049 | 5,004 | 5,016 | 4,866 | 4,555 | 4,451 | 5,284 |
| 2007 | 4,755 | 4,390 | 4,609 | 4,604 | 4,873 | 4,766 | 5,140 | 5,089 | 4,405 | 4,097 | 3,649 | 4,459 |
| 2008 | 4,981 | 4,237 | 4,609 | 4,468 | 4,655 | 4,926 | 5,431 | 5,126 | 5,177 | 4,938 | 4,718 | 4,792 |
| 2009 | 4,815 | 4,120 | 4,651 | 4,486 | 4,946 | 4,891 | 4,839 | 4,475 | 4,636 | 4,549 | 4,137 | 4,638 |
| 2010 | 4,273 | 3,815 | 4,352 | 4,397 | 4,517 | 4,407 | 4,720 | 4,449 | 4,495 | 4,508 | 4,329 | 4,540 |
| 2011 | 4,398 | 4,221 | 4,600 | 4,160 | 4,131 | 4,802 | 5,154 | 4,891 | 4,707 | 4,753 | 4,504 | 4,582 |
| 2012 | 4,299 | 4,115 | 4,472 | 4,527 | 4,648 | 4,608 | 4,978 | 5,160 | 4,829 | 4,844 | 4,741 | 4,670 |
| 2013 | 4,662 | 4,179 | 4,922 | 4,506 | 4,597 | 4,676 | 4,860 | 4,826 | 4,655 | 5,102 | 4,573 | 4,727 |
| 2014 | 4,659 | 3,978 | 4,519 | 4,282 | 4,518 | 4,173 | 5,010 | 4,741 | 4,741 | 4,773 | 4,373 | 4,941 |
| 2015 | 4,734 | 3,686 | 4,507 | 4,301 | 4,265 | 4,404 | 4,761 | 4,526 | 4,460 | 4,143 | 3,956 | 4,258 |
| 2016 | 4,465 | 3,869 | 4,477 | 4,763 | 4,463 | 4,508 | 5,141 | 4,954 | 4,438 | 4,090 | 4,295 | 4,876 |
| 2017 | 4,538 | 3,878 | 4,662 | 5,043 | 4,722 | 4,390 | 4,817 | 5,036 | 4,814 | 4,288 | 4,637 | 5,122 |
| 2018 | 4,560 | 4,369 | 5,083 | 4,763 | 4,859 | 4,821 | 5,057 | 5,276 | 4,875 | 4,648 | 4,586 | 4,845 |
| 2019 | 4,605 | 3,981 | 4,792 | 4,235 | 4,229 | 4,455 | 4,970 | 4,929 | 4,213 | 4,396 | 4,597 | 5,087 |
| 2020 | 4,527 | 4,495 | 4,336 | 3,254 | 3,058 | 2,896 | 3,442 | 3,819 | 3,835 | 3,705 | 3,501 | 3,600 |
| 2021 | 3,461 | 3,004 | 3,592 | 3,835 | 4,016 | 3,915 | 3,764 | 4,006 | 3,941 | 3,744 | 3,658 | 3,940 |
| 2022 | 3,321 | 3,436 | 3,912 | 3,929 | 4,220 | 3,899 | 3,929 | 3,868 | 3,663 | 4,005 | 3,858 | 4,082 |
| 2023 | 3,585 | 3,312 | 3,877 | 3,799 | 3,974 | 4,206 | 3,942 | 3,948 | 3,898 | 3,335 | 3,255 | 3,685 |
| 2024 | 3,674 | |||||||||||
| - = No Data Reported; -- = Not Applicable; NA = Not Available; W = Withheld to avoid disclosure of individual company data. |
| Release Date: 3/29/2024 |
| Next Release Date: 4/30/2024 |
Referring Pages: