|
Download Data (XLS File) |
|
||||||||
|
||||||||
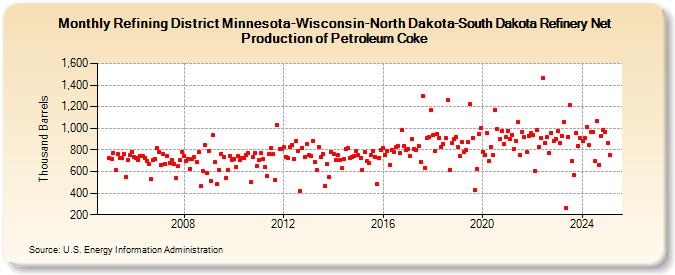
| Refining District Minnesota-Wisconsin-North Dakota-South Dakota Refinery Net Production of Petroleum Coke (Thousand Barrels) | ||||||||
| Year | Jan | Feb | Mar | Apr | May | Jun | Jul | Aug | Sep | Oct | Nov | Dec |
|---|---|---|---|---|---|---|---|---|---|---|---|---|
| 2005 | 729 | 716 | 775 | 612 | 761 | 724 | 726 | 766 | 553 | 708 | 751 | 784 |
| 2006 | 733 | 726 | 709 | 743 | 747 | 723 | 701 | 671 | 529 | 702 | 716 | 814 |
| 2007 | 783 | 664 | 764 | 672 | 739 | 677 | 709 | 670 | 543 | 647 | 705 | 785 |
| 2008 | 746 | 693 | 712 | 627 | 717 | 731 | 689 | 777 | 462 | 606 | 844 | 587 |
| 2009 | 786 | 516 | 937 | 685 | 481 | 614 | 766 | 738 | 539 | 613 | 743 | 708 |
| 2010 | 712 | 638 | 740 | 702 | 725 | 723 | 751 | 770 | 499 | 732 | 768 | 652 |
| 2011 | 708 | 769 | 712 | 646 | 562 | 762 | 822 | 759 | 523 | 1,034 | 806 | 812 |
| 2012 | 825 | 735 | 724 | 829 | 847 | 716 | 880 | 794 | 420 | 819 | 733 | 851 |
| 2013 | 756 | 748 | 884 | 692 | 615 | 831 | 731 | 764 | 464 | 669 | 547 | 782 |
| 2014 | 766 | 707 | 751 | 709 | 631 | 713 | 808 | 815 | 728 | 731 | 748 | 792 |
| 2015 | 750 | 721 | 617 | 784 | 693 | 682 | 750 | 793 | 733 | 480 | 728 | 800 |
| 2016 | 813 | 756 | 793 | 661 | 795 | 784 | 823 | 835 | 768 | 984 | 835 | 796 |
| 2017 | 812 | 739 | 904 | 807 | 798 | 835 | 691 | 1,300 | 635 | 907 | 916 | 1,166 |
| 2018 | 939 | 792 | 946 | 911 | 825 | 852 | 911 | 1,264 | 613 | 860 | 898 | 922 |
| 2019 | 824 | 740 | 874 | 779 | 795 | 875 | 1,222 | 911 | 425 | 620 | 951 | 1,000 |
| 2020 | 785 | 753 | 957 | 693 | 831 | 750 | 1,173 | 991 | 897 | 974 | 853 | 921 |
| 2021 | 977 | 903 | 940 | 807 | 883 | 1,060 | 753 | 970 | 917 | 777 | 932 | 953 |
| 2022 | 937 | 608 | 981 | 828 | 909 | 1,467 | 862 | 919 | 773 | 960 | 886 | 904 |
| 2023 | 977 | 860 | 932 | 1,062 | 265 | 924 | 1,216 | 696 | 566 | 955 | 839 | 907 |
| 2024 | 885 | 907 | 1,015 | 841 | 964 | 966 | 695 | 1,068 | 664 | 928 | 987 | 962 |
| 2025 | 868 | 755 | 1,003 | 534 | ||||||||
| - = No Data Reported; -- = Not Applicable; NA = Not Available; W = Withheld to avoid disclosure of individual company data. |
| Release Date: 6/30/2025 |
| Next Release Date: 7/31/2025 |