|
Download Data (XLS File) |
|
||||||||
|
||||||||
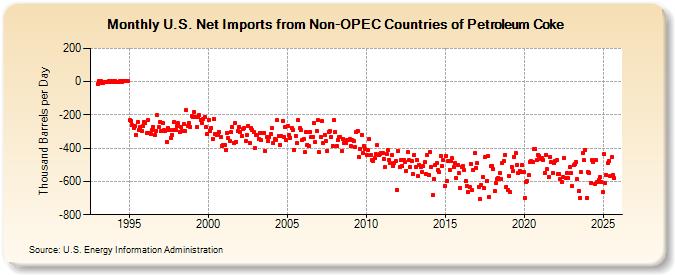
| U.S. Net Imports from Non-OPEC Countries of Petroleum Coke (Thousand Barrels per Day) | ||||||||
| Year | Jan | Feb | Mar | Apr | May | Jun | Jul | Aug | Sep | Oct | Nov | Dec |
|---|---|---|---|---|---|---|---|---|---|---|---|---|
| 1993 | -17 | 1 | 1 | -10 | -7 | 0 | -1 | 0 | 1 | -1 | 1 | 0 |
| 1994 | 2 | 5 | 0 | -3 | -1 | 1 | 0 | 3 | 2 | 2 | 2 | 2 |
| 1995 | -231 | -235 | -260 | -278 | -265 | -319 | -245 | -292 | -275 | -294 | -265 | -245 |
| 1996 | -246 | -309 | -232 | -310 | -315 | -291 | -271 | -322 | -294 | -203 | -274 | -240 |
| 1997 | -299 | -247 | -293 | -296 | -360 | -276 | -288 | -338 | -318 | -292 | -242 | -289 |
| 1998 | -269 | -251 | -300 | -270 | -297 | -254 | -295 | -172 | -265 | -249 | -273 | -208 |
| 1999 | -210 | -182 | -215 | -270 | -214 | -202 | -232 | -249 | -222 | -214 | -274 | -317 |
| 2000 | -228 | -295 | -276 | -344 | -226 | -313 | -323 | -315 | -302 | -331 | -385 | -382 |
| 2001 | -380 | -410 | -307 | -340 | -354 | -303 | -275 | -368 | -248 | -360 | -299 | -274 |
| 2002 | -302 | -329 | -287 | -279 | -357 | -320 | -266 | -366 | -277 | -290 | -305 | -401 |
| 2003 | -321 | -318 | -342 | -311 | -351 | -308 | -307 | -419 | -333 | -355 | -330 | -314 |
| 2004 | -281 | -369 | -347 | -348 | -233 | -325 | -378 | -327 | -235 | -332 | -275 | -350 |
| 2005 | -265 | -323 | -336 | -280 | -289 | -409 | -326 | -371 | -233 | -281 | -293 | -349 |
| 2006 | -346 | -424 | -301 | -379 | -387 | -300 | -331 | -331 | -249 | -363 | -295 | -233 |
| 2007 | -425 | -331 | -239 | -366 | -318 | -359 | -415 | -301 | -298 | -330 | -386 | -232 |
| 2008 | -301 | -386 | -353 | -335 | -332 | -414 | -343 | -371 | -366 | -348 | -348 | -347 |
| 2009 | -389 | -348 | -357 | -393 | -305 | -295 | -452 | -404 | -320 | -428 | -388 | -405 |
| 2010 | -439 | -413 | -346 | -443 | -469 | -479 | -459 | -436 | -383 | -440 | -437 | -426 |
| 2011 | -428 | -463 | -516 | -437 | -408 | -471 | -490 | -442 | -510 | -487 | -477 | -650 |
| 2012 | -417 | -512 | -474 | -508 | -472 | -484 | -537 | -423 | -473 | -513 | -480 | -555 |
| 2013 | -442 | -511 | -469 | -570 | -504 | -515 | -544 | -509 | -484 | -556 | -438 | -562 |
| 2014 | -422 | -511 | -683 | -586 | -503 | -491 | -532 | -546 | -448 | -510 | -473 | -630 |
| 2015 | -444 | -598 | -475 | -530 | -480 | -462 | -512 | -490 | -579 | -499 | -550 | -642 |
| 2016 | -514 | -508 | -532 | -599 | -627 | -664 | -634 | -493 | -653 | -532 | -431 | -517 |
| 2017 | -492 | -632 | -708 | -623 | -572 | -642 | -455 | -595 | -447 | -691 | -510 | -506 |
| 2018 | -528 | -660 | -610 | -588 | -578 | -551 | -584 | -489 | -478 | -438 | -632 | -651 |
| 2019 | -566 | -664 | -512 | -536 | -450 | -428 | -501 | -551 | -535 | -543 | -500 | -545 |
| 2020 | -698 | -602 | -600 | -563 | -482 | -479 | -482 | -407 | -405 | -470 | -438 | -447 |
| 2021 | -465 | -459 | -471 | -549 | -440 | -528 | -574 | -453 | -486 | -549 | -491 | -477 |
| 2022 | -473 | -557 | -556 | -584 | -606 | -571 | -458 | -578 | -551 | -581 | -514 | -550 |
| 2023 | -629 | -504 | -494 | -483 | -587 | -657 | -697 | -545 | -427 | -474 | -408 | -700 |
| 2024 | -556 | -552 | -627 | -445 | -493 | -603 | ||||||
| - = No Data Reported; -- = Not Applicable; NA = Not Available; W = Withheld to avoid disclosure of individual company data. |
| Release Date: 8/30/2024 |
| Next Release Date: 9/30/2024 |