|
Download Data (XLS File) |
|
||||||||
|
||||||||
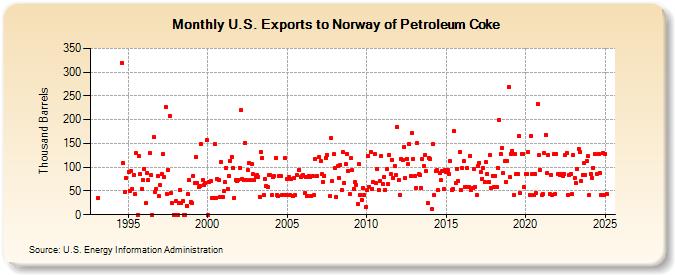
| U.S. Exports to Norway of Petroleum Coke (Thousand Barrels) | ||||||||
| Year | Jan | Feb | Mar | Apr | May | Jun | Jul | Aug | Sep | Oct | Nov | Dec |
|---|---|---|---|---|---|---|---|---|---|---|---|---|
| 1993 | 36 | |||||||||||
| 1994 | 320 | 109 | 48 | 78 | ||||||||
| 1995 | 90 | 50 | 93 | 55 | 83 | 43 | 129 | 0 | 123 | 85 | 55 | 73 |
| 1996 | 97 | 24 | 88 | 73 | 130 | 83 | 0 | 164 | 48 | 55 | 81 | 39 |
| 1997 | 62 | 85 | 127 | 79 | 227 | 43 | 95 | 208 | 45 | 24 | 0 | 0 |
| 1998 | 28 | 0 | 24 | 52 | 24 | 28 | 0 | 0 | 19 | 43 | 73 | 27 |
| 1999 | 25 | 82 | 67 | 121 | 67 | 58 | 60 | 148 | 73 | 62 | 67 | 157 |
| 2000 | 0 | 69 | 70 | 36 | 35 | 148 | 36 | 76 | 74 | 38 | 110 | 38 |
| 2001 | 49 | 68 | 98 | 55 | 81 | 114 | 122 | 98 | 36 | 73 | 70 | 74 |
| 2002 | 99 | 220 | 75 | 72 | 151 | 73 | 94 | 108 | 72 | 107 | 85 | 73 |
| 2003 | 79 | 83 | 80 | 38 | 132 | 120 | 41 | 75 | 60 | 58 | 83 | 83 |
| 2004 | 41 | 79 | 81 | 120 | 41 | 39 | 82 | 82 | 41 | 41 | 120 | 41 |
| 2005 | 76 | 79 | 41 | 75 | 39 | 77 | 41 | 83 | 95 | 79 | 81 | |
| 2006 | 84 | 45 | 79 | 40 | 82 | 79 | 39 | 81 | 41 | 118 | 81 | |
| 2007 | 121 | 113 | 85 | 69 | 82 | 120 | 126 | 39 | 161 | 70 | 127 | |
| 2008 | 99 | 38 | 102 | 77 | 105 | 51 | 131 | 67 | 106 | 128 | 92 | 43 |
| 2009 | 119 | 94 | 55 | 69 | 63 | 22 | 106 | 41 | 31 | 56 | 41 | 16 |
| 2010 | 52 | 123 | 59 | 132 | 55 | 69 | 127 | 66 | 96 | 53 | 71 | 124 |
| 2011 | 64 | 79 | 53 | 96 | 65 | 126 | 85 | 116 | 77 | 102 | 84 | 185 |
| 2012 | 73 | 41 | 117 | 115 | 142 | 77 | 118 | 107 | 149 | 81 | 172 | 117 |
| 2013 | 81 | 57 | 150 | 85 | 83 | 57 | 117 | 103 | 125 | 91 | 24 | 119 |
| 2014 | 117 | 11 | 148 | 41 | 92 | 94 | 51 | 87 | 72 | 93 | 54 | 95 |
| 2015 | 89 | 95 | 86 | 112 | 52 | 55 | 176 | 66 | 97 | 70 | 132 | 53 |
| 2016 | 98 | 112 | 58 | 58 | 98 | 58 | 124 | 53 | 56 | 97 | 58 | 42 |
| 2017 | 103 | 109 | 89 | 76 | 98 | 68 | 110 | 86 | 69 | 126 | 56 | 82 |
| 2018 | 58 | 82 | 58 | 99 | 200 | 128 | 141 | 87 | 112 | 69 | 113 | 269 |
| 2019 | 80 | 128 | 135 | 42 | 127 | 86 | 86 | 166 | 45 | 128 | 128 | 58 |
| 2020 | 86 | 86 | 131 | 42 | 166 | 86 | 42 | 86 | 45 | 234 | 125 | 94 |
| 2021 | 42 | 44 | 130 | 168 | 88 | 125 | 44 | 84 | 41 | 127 | 44 | 128 |
| 2022 | 86 | 86 | 83 | 86 | 82 | 86 | 126 | 130 | 42 | 84 | 86 | 44 |
| 2023 | 126 | 77 | 67 | 96 | 139 | 131 | 71 | 84 | 108 | 84 | 113 | 123 |
| 2024 | 42 | |||||||||||
| - = No Data Reported; -- = Not Applicable; NA = Not Available; W = Withheld to avoid disclosure of individual company data. |
| Release Date: 3/29/2024 |
| Next Release Date: 4/30/2024 |