|
Download Data (XLS File) |
|
||||||||
|
||||||||
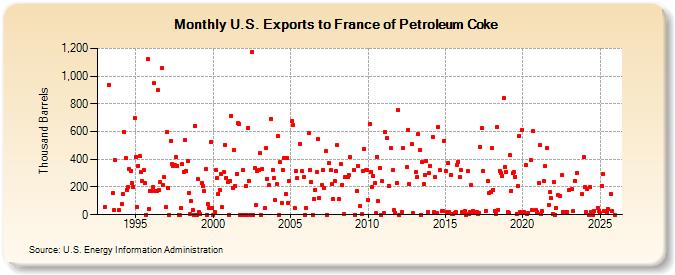
| U.S. Exports to France of Petroleum Coke (Thousand Barrels) | ||||||||
| Year | Jan | Feb | Mar | Apr | May | Jun | Jul | Aug | Sep | Oct | Nov | Dec |
|---|---|---|---|---|---|---|---|---|---|---|---|---|
| 1993 | 58 | 938 | 155 | 33 | 392 | 33 | ||||||
| 1994 | 77 | 153 | 596 | 412 | 181 | 198 | 327 | 316 | 232 | 201 | 699 | |
| 1995 | 418 | 55 | 355 | 421 | 310 | 241 | 326 | 228 | 0 | 1,122 | 38 | 170 |
| 1996 | 172 | 198 | 947 | 172 | 173 | 899 | 177 | 233 | 1,062 | 212 | 272 | 56 |
| 1997 | 599 | 196 | 1 | 535 | 368 | 350 | 360 | 418 | 355 | 0 | 1 | 45 |
| 1998 | 364 | 311 | 539 | 318 | 389 | 156 | 8 | 96 | 33 | 0 | 641 | 0 |
| 1999 | 255 | 16 | 3 | 230 | 204 | 170 | 327 | 1 | 76 | 52 | 526 | 52 |
| 2000 | 0 | 17 | 324 | 264 | 152 | 181 | 297 | 53 | 307 | 505 | 268 | 233 |
| 2001 | 1 | 244 | 714 | 195 | 466 | 207 | 294 | 660 | 658 | 1 | 0 | 321 |
| 2002 | 0 | 205 | 0 | 629 | 241 | 1 | 1,177 | 1 | 336 | 67 | 317 | 321 |
| 2003 | 446 | 1 | 330 | 50 | 483 | 261 | 212 | 692 | 324 | 268 | ||
| 2004 | 104 | 221 | 568 | 0 | 378 | 88 | 323 | 408 | 153 | 406 | 88 | 242 |
| 2005 | 675 | 647 | 50 | 314 | 264 | 513 | 312 | 269 | 0 | |||
| 2006 | 52 | 590 | 322 | 239 | 1 | 110 | 179 | 306 | 546 | 121 | ||
| 2007 | 216 | 325 | 196 | 457 | 1 | 371 | 320 | 221 | 111 | 242 | 314 | |
| 2008 | 502 | 110 | 364 | 216 | 2 | 272 | 271 | 289 | 414 | |||
| 2009 | 326 | 0 | 173 | 355 | 66 | 2 | 318 | 475 | 320 | 322 | ||
| 2010 | 104 | 654 | 306 | 197 | 281 | 228 | 14 | 419 | 96 | 338 | 0 | 240 |
| 2011 | 14 | 595 | 556 | 209 | 479 | 322 | 34 | 14 | 229 | 758 | ||
| 2012 | 0 | 21 | 481 | 343 | 614 | 220 | 508 | 15 | ||||
| 2013 | 305 | 273 | 584 | 470 | 0 | 380 | 220 | 289 | 391 | 16 | 298 | |
| 2014 | 354 | 561 | 16 | 272 | 9 | 635 | 320 | 25 | 25 | 532 | ||
| 2015 | 318 | 17 | 373 | 16 | 290 | 2 | 4 | 11 | 18 | 361 | 383 | 272 |
| 2016 | 322 | 17 | 17 | 25 | 1 | 314 | 8 | 16 | 213 | 25 | 17 | 16 |
| 2017 | 17 | 6 | 12 | 490 | 626 | 316 | 25 | 244 | 160 | 166 | ||
| 2018 | 479 | 181 | 28 | 7 | 633 | 36 | 319 | 303 | 280 | 842 | 347 | 309 |
| 2019 | 16 | 14 | 428 | 173 | 298 | 311 | 275 | 8 | 209 | 571 | 16 | 610 |
| 2020 | 17 | 16 | 359 | 8 | 10 | 392 | 33 | 602 | 33 | 16 | ||
| 2021 | 230 | 500 | 8 | 25 | 241 | 350 | 482 | 71 | 166 | 117 | 8 | |
| 2022 | 236 | 0 | 51 | 139 | 138 | 286 | 17 | 21 | 22 | |||
| 2023 | 179 | 182 | 25 | 242 | 301 | 151 | 558 | |||||
| 2024 | 198 | 22 | 185 | 0 | ||||||||
| - = No Data Reported; -- = Not Applicable; NA = Not Available; W = Withheld to avoid disclosure of individual company data. |
| Release Date: 6/28/2024 |
| Next Release Date: 7/31/2024 |