|
Download Data (XLS File) |
|
||||||||
|
||||||||
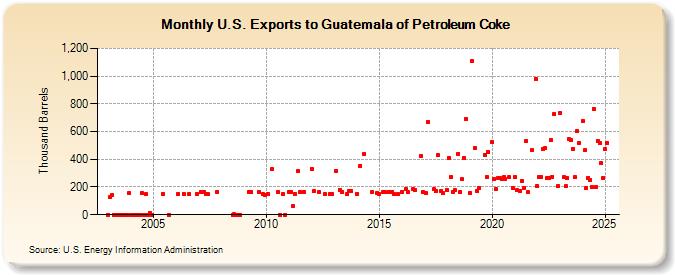
| U.S. Exports to Guatemala of Petroleum Coke (Thousand Barrels) | ||||||||
| Year | Jan | Feb | Mar | Apr | May | Jun | Jul | Aug | Sep | Oct | Nov | Dec |
|---|---|---|---|---|---|---|---|---|---|---|---|---|
| 2003 | 0 | 129 | 142 | 0 | 0 | 0 | 0 | 0 | 0 | 0 | 0 | 156 |
| 2004 | 0 | 0 | 0 | 0 | 0 | 0 | 156 | 0 | 146 | 0 | 15 | 0 |
| 2005 | 148 | 0 | ||||||||||
| 2006 | 148 | 151 | 150 | 151 | ||||||||
| 2007 | 165 | 167 | 150 | 149 | 165 | |||||||
| 2008 | 1 | 2 | 0 | 0 | 0 | |||||||
| 2009 | 164 | 165 | 165 | 149 | 144 | |||||||
| 2010 | 150 | 331 | 166 | 0 | 149 | 0 | ||||||
| 2011 | 167 | 165 | 61 | 149 | 314 | 164 | 166 | |||||
| 2012 | 332 | 168 | 165 | 149 | 147 | 149 | ||||||
| 2013 | 318 | 181 | 167 | 146 | 172 | 170 | ||||||
| 2014 | 150 | 354 | 435 | 162 | 156 | |||||||
| 2015 | 149 | 164 | 163 | 165 | 166 | 149 | 149 | |||||
| 2016 | 163 | 182 | 161 | 182 | 181 | 423 | 164 | |||||
| 2017 | 154 | 670 | 182 | 172 | 430 | 168 | 156 | |||||
| 2018 | 175 | 411 | 272 | 165 | 177 | 441 | 165 | 255 | 410 | 692 | ||
| 2019 | 157 | 1,108 | 480 | 173 | 193 | 433 | 272 | 454 | ||||
| 2020 | 523 | 256 | 187 | 264 | 264 | 261 | 270 | 259 | 269 | 193 | ||
| 2021 | 271 | 175 | 173 | 245 | 193 | 531 | 162 | 465 | 982 | |||
| 2022 | 204 | 270 | 273 | 474 | 478 | 262 | 267 | 536 | 275 | 728 | 207 | |
| 2023 | 736 | 269 | 205 | 265 | 543 | 536 | 477 | 272 | 602 | 521 | ||
| 2024 | 675 | |||||||||||
| - = No Data Reported; -- = Not Applicable; NA = Not Available; W = Withheld to avoid disclosure of individual company data. |
| Release Date: 3/29/2024 |
| Next Release Date: 4/30/2024 |