|
Download Data (XLS File) |
|
||||||||
|
||||||||
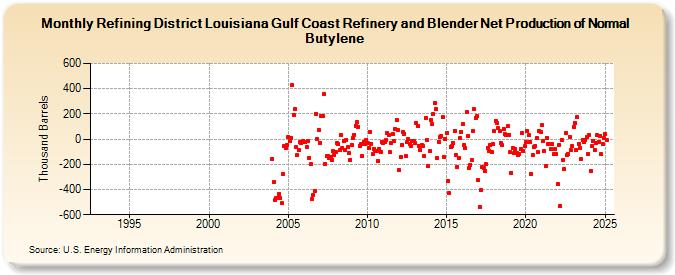
| Refining District Louisiana Gulf Coast Refinery and Blender Net Production of Normal Butylene (Thousand Barrels) | ||||||||
| Year | Jan | Feb | Mar | Apr | May | Jun | Jul | Aug | Sep | Oct | Nov | Dec |
|---|---|---|---|---|---|---|---|---|---|---|---|---|
| 1993 | W | W | W | W | W | W | W | W | W | W | W | W |
| 1994 | W | W | W | W | W | W | W | W | W | W | W | W |
| 1995 | W | W | W | W | W | W | W | W | W | W | W | W |
| 1996 | W | W | W | W | W | W | W | W | W | W | W | W |
| 1997 | W | W | W | W | W | W | W | W | W | W | W | W |
| 1998 | W | W | W | W | W | W | W | W | W | W | W | W |
| 1999 | W | W | W | W | W | W | W | W | W | W | W | W |
| 2000 | W | W | W | W | W | W | W | W | W | W | W | W |
| 2001 | W | W | W | W | W | W | W | W | W | W | W | W |
| 2002 | W | W | W | W | W | W | W | W | W | W | W | W |
| 2003 | W | W | W | W | W | W | W | W | W | W | W | W |
| 2004 | -155 | -340 | -480 | -467 | -469 | -432 | -466 | -511 | -277 | -58 | -71 | -49 |
| 2005 | 20 | -17 | 9 | 429 | 195 | 236 | -65 | -128 | -86 | -25 | -30 | -19 |
| 2006 | -26 | -25 | -60 | -15 | -147 | -201 | -479 | -443 | -413 | 203 | 1 | 74 |
| 2007 | -27 | 184 | 187 | 359 | -195 | -136 | -138 | -150 | -142 | -163 | -96 | -130 |
| 2008 | -106 | -31 | -35 | -88 | 34 | -69 | -18 | -83 | -10 | -63 | -112 | -163 |
| 2009 | -44 | 12 | 33 | 107 | 136 | 99 | -51 | -42 | -133 | -25 | -39 | -5 |
| 2010 | -29 | -68 | 60 | -35 | -120 | -75 | -94 | -92 | -175 | -77 | -103 | -25 |
| 2011 | -31 | -24 | -9 | 52 | 35 | -103 | -31 | 43 | -19 | 77 | 154 | 72 |
| 2012 | -248 | -145 | -43 | 54 | 43 | -138 | -24 | -3 | -36 | -54 | -15 | -14 |
| 2013 | -34 | 129 | 105 | -52 | -86 | -44 | -56 | -134 | 171 | -7 | -214 | -96 |
| 2014 | 150 | 120 | 201 | 287 | 236 | -152 | -21 | 15 | 23 | 175 | -139 | 3 |
| 2015 | 51 | -334 | -427 | -60 | -55 | -31 | 67 | -129 | -224 | -150 | 12 | 59 |
| 2016 | 116 | -47 | -74 | 216 | 28 | -232 | -202 | -168 | 65 | 238 | 170 | 181 |
| 2017 | -326 | -538 | -405 | -220 | -233 | -251 | -199 | -70 | -91 | -47 | -101 | -37 |
| 2018 | 63 | 144 | 130 | 85 | 61 | -32 | -49 | 83 | 41 | 33 | 100 | 36 |
| 2019 | -105 | -267 | -72 | -114 | -79 | -107 | -123 | -117 | -79 | 45 | -93 | -57 |
| 2020 | -24 | 62 | 30 | -20 | -277 | -123 | -62 | -53 | 7 | -104 | 65 | 56 |
| 2021 | 109 | -14 | -96 | -214 | 8 | -39 | -36 | -80 | -37 | -120 | -75 | -118 |
| 2022 | -356 | -44 | -528 | -8 | -164 | -241 | 48 | -127 | -117 | 19 | -89 | -55 |
| 2023 | 94 | 131 | -84 | 175 | -35 | -69 | -160 | -5 | -20 | -7 | 13 | -115 |
| 2024 | 34 | -251 | -54 | -12 | ||||||||
| - = No Data Reported; -- = Not Applicable; NA = Not Available; W = Withheld to avoid disclosure of individual company data. |
| Release Date: 6/28/2024 |
| Next Release Date: 7/31/2024 |