|
Download Data (XLS File) |
|
||||||||
|
||||||||
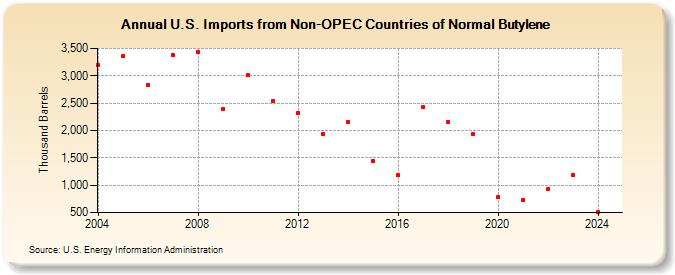
| U.S. Imports from Non-OPEC Countries of Normal Butylene (Thousand Barrels) | ||||||||
| Decade | Year-0 | Year-1 | Year-2 | Year-3 | Year-4 | Year-5 | Year-6 | Year-7 | Year-8 | Year-9 |
|---|---|---|---|---|---|---|---|---|---|---|
| 2000's | 3,189 | 3,356 | 2,827 | 3,374 | 3,440 | 2,385 | ||||
| 2010's | 3,012 | 2,542 | 2,321 | 1,927 | 2,155 | 1,445 | 1,181 | 2,433 | 2,164 | 1,931 |
| 2020's | 781 | 734 | 937 | 1,184 |
| - = No Data Reported; -- = Not Applicable; NA = Not Available; W = Withheld to avoid disclosure of individual company data. |
| Release Date: 8/30/2024 |
| Next Release Date: 8/29/2025 |