|
Download Data (XLS File) |
|
||||||||
|
||||||||
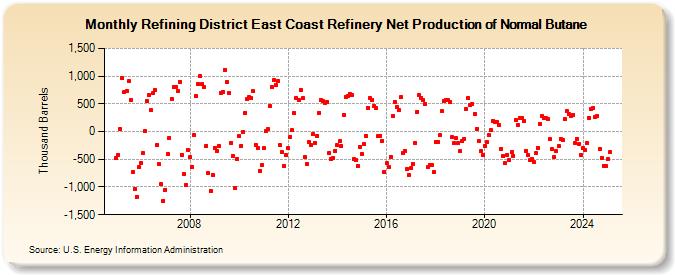
| Refining District East Coast Refinery Net Production of Normal Butane (Thousand Barrels) | ||||||||
| Year | Jan | Feb | Mar | Apr | May | Jun | Jul | Aug | Sep | Oct | Nov | Dec |
|---|---|---|---|---|---|---|---|---|---|---|---|---|
| 2005 | -477 | -414 | 42 | 960 | 720 | 732 | 904 | 571 | -733 | -1,034 | -1,173 | -645 |
| 2006 | -567 | -388 | 5 | 543 | 663 | 387 | 688 | 747 | -242 | -591 | -955 | -1,247 |
| 2007 | -1,047 | -407 | -116 | 594 | 804 | 809 | 736 | 900 | -415 | -759 | -967 | -329 |
| 2008 | -466 | -639 | -55 | 639 | 855 | 1,000 | 862 | 795 | -254 | -747 | -1,067 | -777 |
| 2009 | -279 | -278 | -255 | 664 | 842 | 1,124 | 926 | 719 | -200 | -454 | -1,014 | -509 |
| 2010 | -77 | -252 | -3 | 339 | 596 | 616 | 601 | 725 | -234 | -292 | -703 | -607 |
| 2011 | -303 | 2 | 40 | 468 | 796 | 922 | 841 | 913 | -245 | -376 | -616 | -424 |
| 2012 | -303 | -93 | 22 | 334 | 603 | 561 | 750 | 605 | -460 | -581 | -190 | -242 |
| 2013 | -50 | -199 | -77 | 342 | 575 | 546 | 524 | 535 | -384 | -495 | -475 | -344 |
| 2014 | -245 | -176 | -255 | 306 | 627 | 649 | 682 | 658 | -504 | -516 | -616 | -277 |
| 2015 | -396 | -227 | -73 | 430 | 597 | 570 | 460 | 417 | -81 | -73 | -169 | -722 |
| 2016 | -574 | -632 | -458 | 283 | 538 | 436 | 386 | 620 | -394 | -343 | -675 | -783 |
| 2017 | -658 | -589 | -200 | 359 | 651 | 614 | 561 | 499 | -647 | -603 | -610 | -734 |
| 2018 | -182 | -183 | -68 | 370 | 547 | 561 | 562 | 530 | -101 | -215 | -121 | -215 |
| 2019 | -356 | -177 | -132 | 411 | 598 | 478 | 497 | 325 | 52 | -171 | -356 | -418 |
| 2020 | -253 | -192 | -65 | 23 | 199 | 179 | 171 | 116 | -306 | -443 | -566 | -418 |
| 2021 | -512 | -374 | -433 | 209 | 119 | 246 | 236 | 191 | -346 | -419 | -514 | -490 |
| 2022 | -551 | -384 | -289 | 134 | 279 | 238 | 238 | 229 | -138 | -320 | -458 | -347 |
| 2023 | -268 | -134 | -150 | 225 | 370 | 312 | 284 | 302 | -210 | -129 | -216 | -417 |
| 2024 | -296 | -330 | -214 | 251 | ||||||||
| - = No Data Reported; -- = Not Applicable; NA = Not Available; W = Withheld to avoid disclosure of individual company data. |
| Release Date: 6/28/2024 |
| Next Release Date: 7/31/2024 |