|
Download Data (XLS File) |
|
||||||||
|
||||||||
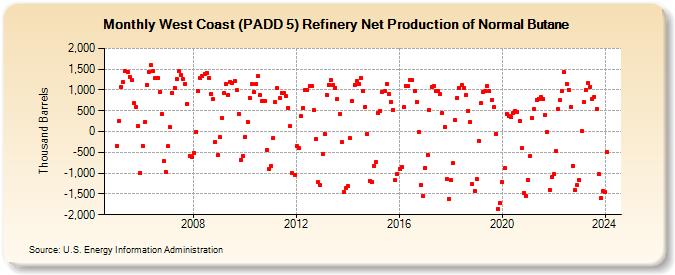
| West Coast (PADD 5) Refinery Net Production of Normal Butane (Thousand Barrels) | ||||||||
| Year | Jan | Feb | Mar | Apr | May | Jun | Jul | Aug | Sep | Oct | Nov | Dec |
|---|---|---|---|---|---|---|---|---|---|---|---|---|
| 2005 | -348 | 255 | 1,082 | 1,184 | 1,456 | 1,433 | 1,320 | 1,239 | 678 | 590 | 134 | -989 |
| 2006 | -345 | 230 | 1,126 | 1,443 | 1,596 | 1,458 | 1,295 | 1,281 | 956 | 429 | -718 | -978 |
| 2007 | -355 | 100 | 931 | 1,057 | 1,270 | 1,452 | 1,356 | 1,255 | 1,148 | 674 | -585 | -619 |
| 2008 | -509 | -3 | 979 | 1,284 | 1,346 | 1,394 | 1,419 | 1,291 | 907 | 781 | -245 | -569 |
| 2009 | -141 | 335 | 929 | 1,132 | 887 | 1,202 | 1,171 | 1,215 | 990 | 430 | -676 | -592 |
| 2010 | -130 | 239 | 817 | 1,140 | 945 | 1,143 | 1,325 | 876 | 728 | 733 | -446 | -904 |
| 2011 | -824 | -159 | 710 | 1,053 | 812 | 936 | 916 | 844 | 576 | 123 | -1,008 | -1,052 |
| 2012 | -348 | -400 | 368 | 575 | 1,010 | 997 | 1,089 | 1,099 | 509 | -179 | -1,224 | -1,293 |
| 2013 | -545 | -62 | 881 | 1,130 | 1,228 | 1,127 | 1,059 | 785 | 430 | -254 | -1,462 | -1,363 |
| 2014 | -1,318 | -162 | 733 | 1,130 | 1,211 | 1,140 | 1,299 | 970 | 598 | -61 | -1,184 | -1,218 |
| 2015 | -824 | -728 | 449 | 500 | 962 | 975 | 1,147 | 900 | 711 | 519 | -1,164 | -1,028 |
| 2016 | -906 | -849 | 582 | 1,099 | 1,090 | 1,234 | 1,228 | 985 | 720 | -14 | -1,297 | -1,561 |
| 2017 | -866 | -552 | 508 | 1,074 | 1,091 | 984 | 985 | 894 | 445 | 113 | -1,150 | -1,614 |
| 2018 | -1,174 | -761 | 273 | 814 | 1,048 | 1,121 | 1,053 | 883 | 490 | 230 | -1,269 | -1,420 |
| 2019 | -1,146 | -226 | 678 | 944 | 964 | 1,100 | 977 | 767 | 590 | -52 | -1,858 | -1,708 |
| 2020 | -1,220 | -876 | 428 | 369 | 349 | 458 | 500 | 475 | 250 | -400 | -1,471 | -1,545 |
| 2021 | -1,154 | -590 | 328 | 534 | 760 | 792 | 821 | 776 | 407 | -9 | -1,398 | -1,094 |
| 2022 | -1,027 | -479 | 548 | 747 | 982 | 1,424 | 1,144 | 1,008 | 592 | -831 | -1,398 | -1,283 |
| 2023 | -1,162 | 7 | 711 | 1,007 | 1,169 | 1,080 | 785 | 840 | 540 | -1,031 | -1,605 | -1,441 |
| 2024 | -1,448 | |||||||||||
| - = No Data Reported; -- = Not Applicable; NA = Not Available; W = Withheld to avoid disclosure of individual company data. |
| Release Date: 3/29/2024 |
| Next Release Date: 4/30/2024 |
Referring Pages: