|
Download Data (XLS File) |
|
||||||||
|
||||||||
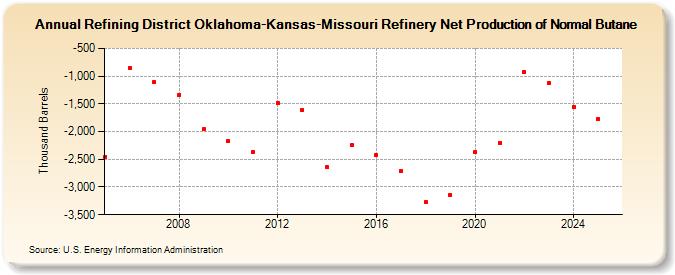
| Refining District Oklahoma-Kansas-Missouri Refinery Net Production of Normal Butane (Thousand Barrels) | ||||||||
| Decade | Year-0 | Year-1 | Year-2 | Year-3 | Year-4 | Year-5 | Year-6 | Year-7 | Year-8 | Year-9 |
|---|---|---|---|---|---|---|---|---|---|---|
| 2000's | -2,451 | -848 | -1,107 | -1,332 | -1,968 | |||||
| 2010's | -2,173 | -2,373 | -1,481 | -1,607 | -2,644 | -2,248 | -2,428 | -2,710 | -3,270 | -3,136 |
| 2020's | -2,377 | -2,200 | -924 | -1,116 |
| - = No Data Reported; -- = Not Applicable; NA = Not Available; W = Withheld to avoid disclosure of individual company data. |
| Release Date: 3/29/2024 |
| Next Release Date: 8/30/2024 |