|
Download Data (XLS File) |
|
||||||||
|
||||||||
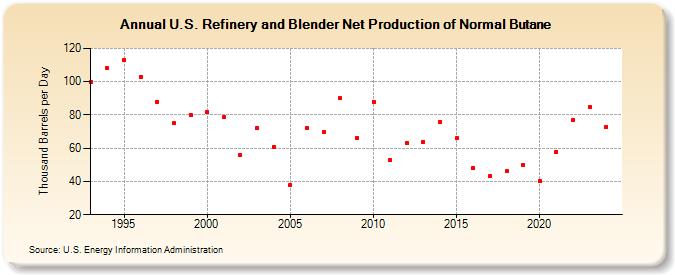
| U.S. Refinery and Blender Net Production of Normal Butane (Thousand Barrels per Day) | ||||||||
| Decade | Year-0 | Year-1 | Year-2 | Year-3 | Year-4 | Year-5 | Year-6 | Year-7 | Year-8 | Year-9 |
|---|---|---|---|---|---|---|---|---|---|---|
| 1990's | 100 | 108 | 113 | 103 | 88 | 75 | 80 | |||
| 2000's | 82 | 79 | 56 | 72 | 61 | 38 | 72 | 70 | 90 | 71 |
| 2010's | 88 | 53 | 63 | 64 | 76 | 66 | 48 | 43 | 46 | 50 |
| 2020's | 40 | 58 | 77 | 84 |
| - = No Data Reported; -- = Not Applicable; NA = Not Available; W = Withheld to avoid disclosure of individual company data. |
| Release Date: 3/29/2024 |
| Next Release Date: 8/30/2024 |