|
Download Data (XLS File) |
|
||||||||
|
||||||||
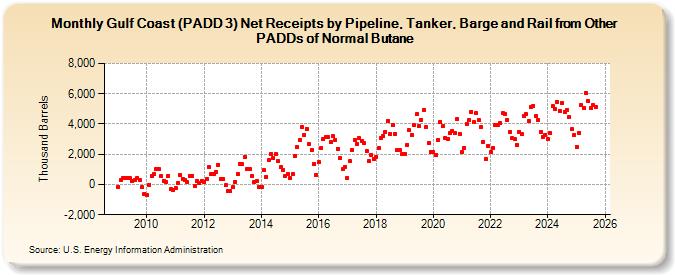
| Gulf Coast (PADD 3) Net Receipts by Pipeline, Tanker, Barge and Rail from Other PADDs of Normal Butane (Thousand Barrels) | ||||||||
| Year | Jan | Feb | Mar | Apr | May | Jun | Jul | Aug | Sep | Oct | Nov | Dec |
|---|---|---|---|---|---|---|---|---|---|---|---|---|
| 2009 | -143 | 276 | 425 | 417 | 399 | 396 | 241 | 285 | 428 | 275 | -192 | -606 |
| 2010 | -701 | -14 | 561 | 682 | 995 | 1,036 | 537 | 254 | 174 | 588 | -309 | -334 |
| 2011 | -243 | 130 | 627 | 392 | 306 | 172 | 559 | 589 | -121 | 227 | 96 | 232 |
| 2012 | 153 | 353 | 1,180 | 661 | 699 | 844 | 1,317 | 384 | 354 | -68 | -436 | -432 |
| 2013 | -173 | 187 | 681 | 1,362 | 1,357 | 1,815 | 1,044 | 997 | 555 | 141 | 222 | -192 |
| 2014 | -164 | 933 | 513 | 1,597 | 2,045 | 1,744 | 1,995 | 1,551 | 1,126 | 968 | 588 | 722 |
| 2015 | 401 | 686 | 1,896 | 2,460 | 2,926 | 3,800 | 3,270 | 3,677 | 2,686 | 2,252 | 1,363 | 615 |
| 2016 | 1,469 | 2,408 | 2,995 | 3,135 | 3,108 | 2,792 | 3,172 | 2,948 | 2,378 | 1,721 | 1,005 | 1,178 |
| 2017 | 418 | 1,522 | 2,280 | 2,944 | 2,691 | 3,043 | 2,896 | 2,729 | 2,188 | 1,535 | 1,973 | 1,683 |
| 2018 | 1,828 | 2,403 | 3,081 | 3,220 | 3,473 | 4,222 | 3,327 | 3,941 | 3,364 | 2,293 | 2,312 | 1,986 |
| 2019 | 2,007 | 2,631 | 3,569 | 3,295 | 3,915 | 4,629 | 3,872 | 4,286 | 4,942 | 3,788 | 2,755 | 2,174 |
| 2020 | 2,146 | 1,943 | 2,961 | 4,142 | 3,850 | 3,104 | 3,028 | 3,385 | 3,536 | 3,422 | 4,338 | 3,370 |
| 2021 | 2,133 | 2,423 | 3,975 | 4,279 | 4,813 | 4,116 | 4,702 | 4,257 | 3,816 | 2,839 | 1,676 | 2,567 |
| 2022 | 2,139 | 2,414 | 3,928 | 3,914 | 4,053 | 4,699 | 4,661 | 4,292 | 3,497 | 3,060 | 3,032 | 2,631 |
| 2023 | 3,501 | 3,311 | 4,528 | 4,625 | 4,182 | 5,145 | 5,210 | 4,549 | 4,257 | 3,495 | 3,168 | 3,280 |
| 2024 | 2,862 | |||||||||||
| - = No Data Reported; -- = Not Applicable; NA = Not Available; W = Withheld to avoid disclosure of individual company data. |
| Release Date: 3/29/2024 |
| Next Release Date: 4/30/2024 |