|
Download Data (XLS File) |
|
||||||||
|
||||||||
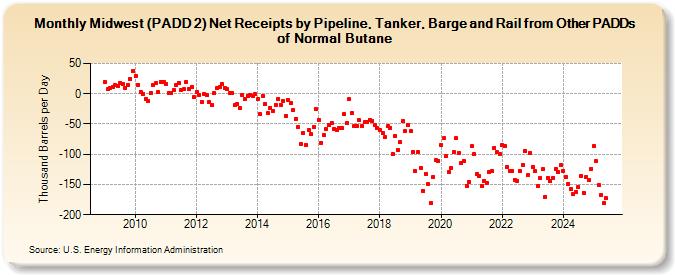
| Midwest (PADD 2) Net Receipts by Pipeline, Tanker, Barge and Rail from Other PADDs of Normal Butane (Thousand Barrels per Day) | ||||||||
| Year | Jan | Feb | Mar | Apr | May | Jun | Jul | Aug | Sep | Oct | Nov | Dec |
|---|---|---|---|---|---|---|---|---|---|---|---|---|
| 2009 | 20 | 7 | 10 | 11 | 14 | 12 | 18 | 16 | 10 | 15 | 25 | 37 |
| 2010 | 29 | 15 | 3 | 0 | -9 | -12 | 1 | 15 | 17 | 3 | 20 | 20 |
| 2011 | 16 | 1 | 2 | 6 | 14 | 18 | 6 | 7 | 19 | 8 | 11 | -6 |
| 2012 | 3 | -2 | -13 | 0 | -2 | -14 | -18 | 1 | 9 | 11 | 16 | 10 |
| 2013 | 7 | 1 | 1 | -19 | -17 | -24 | -2 | -8 | -4 | -2 | -4 | -1 |
| 2014 | -9 | -34 | -4 | -17 | -32 | -23 | -28 | -19 | -8 | -18 | -12 | -36 |
| 2015 | -10 | -16 | -27 | -41 | -55 | -83 | -65 | -84 | -60 | -67 | -55 | -25 |
| 2016 | -43 | -81 | -69 | -58 | -52 | -48 | -58 | -60 | -56 | -57 | -34 | -48 |
| 2017 | -9 | -32 | -54 | -53 | -44 | -53 | -47 | -46 | -43 | -45 | -52 | -57 |
| 2018 | -60 | -65 | -72 | -54 | -56 | -100 | -70 | -93 | -80 | -45 | -62 | -52 |
| 2019 | -62 | -96 | -128 | -97 | -122 | -161 | -132 | -149 | -181 | -137 | -110 | -111 |
| 2020 | -84 | -74 | -103 | -130 | -123 | -96 | -74 | -98 | -115 | -111 | -152 | -146 |
| 2021 | -87 | -100 | -133 | -136 | -152 | -144 | -147 | -130 | -128 | -89 | -97 | -100 |
| 2022 | -85 | -87 | -121 | -127 | -127 | -142 | -144 | -128 | -117 | -94 | -135 | -98 |
| 2023 | -123 | -128 | -150 | -153 | -124 | -170 | -139 | -145 | -145 | -124 | -128 | -124 |
| 2024 | -106 | |||||||||||
| - = No Data Reported; -- = Not Applicable; NA = Not Available; W = Withheld to avoid disclosure of individual company data. |
| Release Date: 3/29/2024 |
| Next Release Date: 4/30/2024 |