|
Download Data (XLS File) |
|
||||||||
|
||||||||
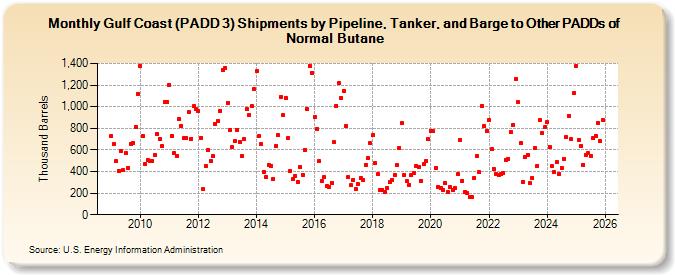
| Gulf Coast (PADD 3) Shipments by Pipeline, Tanker, and Barge to Other PADDs of Normal Butane (Thousand Barrels) | ||||||||
| Year | Jan | Feb | Mar | Apr | May | Jun | Jul | Aug | Sep | Oct | Nov | Dec |
|---|---|---|---|---|---|---|---|---|---|---|---|---|
| 2009 | 729 | 658 | 493 | 408 | 590 | 413 | 569 | 436 | 659 | 668 | 814 | 1,120 |
| 2010 | 1,380 | 728 | 472 | 502 | 500 | 495 | 555 | 747 | 700 | 635 | 1,042 | 1,045 |
| 2011 | 1,205 | 733 | 573 | 544 | 887 | 824 | 710 | 708 | 951 | 704 | 1,004 | 974 |
| 2012 | 961 | 711 | 235 | 450 | 599 | 495 | 541 | 837 | 866 | 964 | 1,344 | 1,362 |
| 2013 | 1,038 | 787 | 624 | 679 | 787 | 677 | 545 | 697 | 974 | 925 | 1,004 | 1,161 |
| 2014 | 1,329 | 729 | 652 | 396 | 347 | 464 | 451 | 335 | 636 | 735 | 1,093 | 923 |
| 2015 | 1,083 | 711 | 408 | 327 | 359 | 304 | 442 | 369 | 602 | 976 | 1,379 | 1,316 |
| 2016 | 905 | 795 | 496 | 313 | 349 | 267 | 261 | 298 | 669 | 1,010 | 1,219 | 1,084 |
| 2017 | 1,147 | 821 | 347 | 271 | 322 | 235 | 281 | 344 | 323 | 462 | 524 | 660 |
| 2018 | 736 | 476 | 375 | 230 | 233 | 207 | 245 | 300 | 325 | 372 | 458 | 618 |
| 2019 | 849 | 368 | 308 | 276 | 366 | 386 | 451 | 445 | 315 | 467 | 495 | 698 |
| 2020 | 778 | 772 | 437 | 259 | 243 | 231 | 293 | 208 | 256 | 225 | 244 | 376 |
| 2021 | 692 | 315 | 214 | 201 | 161 | 166 | 344 | 543 | 392 | 1,007 | 820 | 776 |
| 2022 | 878 | 605 | 424 | 376 | 371 | 379 | 387 | 507 | 519 | 769 | 833 | 1,258 |
| 2023 | 1,041 | 662 | 304 | 536 | 556 | 295 | 337 | 619 | 451 | 875 | 755 | 808 |
| 2024 | 858 | |||||||||||
| - = No Data Reported; -- = Not Applicable; NA = Not Available; W = Withheld to avoid disclosure of individual company data. |
| Release Date: 3/29/2024 |
| Next Release Date: 4/30/2024 |