|
Download Data (XLS File) |
|
||||||||
|
||||||||
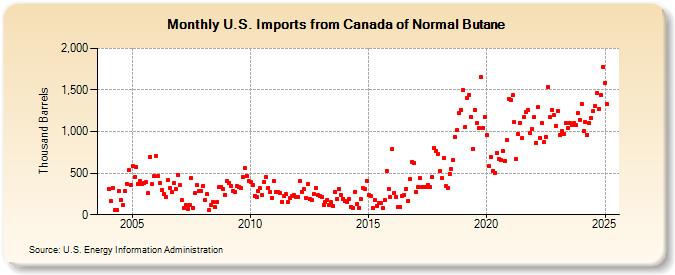
| U.S. Imports from Canada of Normal Butane (Thousand Barrels) | ||||||||
| Year | Jan | Feb | Mar | Apr | May | Jun | Jul | Aug | Sep | Oct | Nov | Dec |
|---|---|---|---|---|---|---|---|---|---|---|---|---|
| 2004 | 314 | 165 | 316 | 56 | 54 | 285 | 171 | 117 | 284 | 373 | 533 | 359 |
| 2005 | 583 | 451 | 568 | 367 | 411 | 366 | 379 | 390 | 258 | 694 | 366 | 462 |
| 2006 | 701 | 465 | 377 | 303 | 251 | 218 | 415 | 319 | 268 | 381 | 307 | 480 |
| 2007 | 358 | 171 | 77 | 118 | 68 | 119 | 443 | 78 | 258 | 353 | 280 | 281 |
| 2008 | 347 | 175 | 244 | 53 | 117 | 152 | 87 | 156 | 333 | 335 | 312 | 242 |
| 2009 | 404 | 382 | 343 | 287 | 271 | 348 | 339 | 317 | 458 | 564 | 467 | 405 |
| 2010 | 395 | 363 | 227 | 209 | 291 | 320 | 238 | 393 | 448 | 325 | 273 | 206 |
| 2011 | 404 | 279 | 278 | 262 | 158 | 223 | 248 | 155 | 202 | 228 | 233 | 212 |
| 2012 | 211 | 400 | 278 | 313 | 204 | 364 | 189 | 179 | 248 | 326 | 237 | 223 |
| 2013 | 210 | 122 | 150 | 181 | 121 | 149 | 106 | 272 | 194 | 307 | 235 | 193 |
| 2014 | 163 | 147 | 191 | 97 | 86 | 276 | 130 | 86 | 184 | 317 | 312 | 407 |
| 2015 | 232 | 221 | 77 | 178 | 106 | 139 | 140 | 76 | 175 | 528 | 304 | 208 |
| 2016 | 794 | 263 | 210 | 92 | 93 | 224 | 242 | 312 | 167 | 425 | 639 | 620 |
| 2017 | 277 | 332 | 436 | 336 | 335 | 335 | 362 | 334 | 451 | 804 | 770 | 732 |
| 2018 | 520 | 442 | 679 | 343 | 326 | 487 | 552 | 658 | 929 | 1,019 | 1,225 | 1,264 |
| 2019 | 1,502 | 1,058 | 1,400 | 1,443 | 1,176 | 787 | 1,261 | 1,101 | 1,040 | 1,652 | 1,040 | 1,177 |
| 2020 | 954 | 580 | 695 | 522 | 501 | 746 | 671 | 656 | 769 | 647 | 900 | 1,392 |
| 2021 | 1,379 | 1,434 | 1,109 | 664 | 970 | 1,105 | 918 | 1,169 | 1,235 | 1,254 | 982 | 1,029 |
| 2022 | 1,170 | 866 | 1,291 | 926 | 1,100 | 869 | 940 | 1,532 | 1,170 | 1,263 | 1,196 | 1,070 |
| 2023 | 1,232 | 852 | 1,064 | 910 | 1,127 | 1,028 | 1,113 | 1,083 | 1,098 | 1,110 | 1,219 | 1,140 |
| 2024 | 1,335 | 1,008 | 1,113 | 961 | ||||||||
| - = No Data Reported; -- = Not Applicable; NA = Not Available; W = Withheld to avoid disclosure of individual company data. |
| Release Date: 6/28/2024 |
| Next Release Date: 7/31/2024 |