|
Download Data (XLS File) |
|
||||||||
|
||||||||
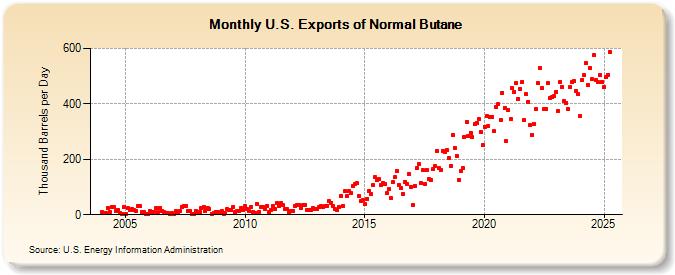
| U.S. Exports of Normal Butane (Thousand Barrels per Day) | ||||||||
| Year | Jan | Feb | Mar | Apr | May | Jun | Jul | Aug | Sep | Oct | Nov | Dec |
|---|---|---|---|---|---|---|---|---|---|---|---|---|
| 2004 | 9 | 7 | 5 | 26 | 10 | 29 | 27 | 12 | 18 | 5 | 4 | 28 |
| 2005 | 4 | 24 | 17 | 20 | 18 | 14 | 31 | 31 | 11 | 8 | 4 | 4 |
| 2006 | 14 | 10 | 10 | 23 | 8 | 25 | 13 | 11 | 7 | 6 | 3 | 7 |
| 2007 | 3 | 12 | 10 | 14 | 28 | 32 | 33 | 13 | 12 | 2 | 2 | 14 |
| 2008 | 8 | 11 | 26 | 28 | 14 | 25 | 22 | 4 | 7 | 10 | 11 | 9 |
| 2009 | 13 | 2 | 5 | 19 | 16 | 18 | 29 | 8 | 12 | 15 | 24 | 18 |
| 2010 | 31 | 20 | 13 | 28 | 10 | 6 | 38 | 11 | 28 | 28 | 21 | 33 |
| 2011 | 11 | 17 | 30 | 20 | 41 | 30 | 44 | 34 | 22 | 19 | 11 | 12 |
| 2012 | 15 | 32 | 35 | 34 | 26 | 34 | 36 | 18 | 17 | 17 | 24 | 20 |
| 2013 | 22 | 27 | 32 | 28 | 30 | 33 | 48 | 44 | 30 | 19 | 17 | 29 |
| 2014 | 69 | 32 | 84 | 69 | 84 | 80 | 103 | 109 | 113 | 68 | 49 | 53 |
| 2015 | 37 | 58 | 85 | 75 | 106 | 136 | 125 | 128 | 107 | 116 | 109 | 78 |
| 2016 | 91 | 59 | 117 | 136 | 157 | 108 | 98 | 76 | 118 | 112 | 147 | 100 |
| 2017 | 35 | 105 | 169 | 183 | 114 | 160 | 111 | 162 | 129 | 125 | 164 | 174 |
| 2018 | 231 | 168 | 161 | 229 | 228 | 233 | 204 | 176 | 287 | 242 | 213 | 126 |
| 2019 | 157 | 168 | 282 | 335 | 285 | 296 | 279 | 327 | 332 | 346 | 298 | 250 |
| 2020 | 318 | 355 | 319 | 352 | 354 | 301 | 387 | 398 | 342 | 440 | 386 | 265 |
| 2021 | 377 | 344 | 456 | 444 | 475 | 419 | 453 | 480 | 341 | 434 | 408 | 323 |
| 2022 | 289 | 329 | 380 | 474 | 531 | 458 | 381 | 380 | 475 | 421 | 424 | 427 |
| 2023 | 467 | 454 | 474 | 515 | 409 | 446 | 405 | 480 | 521 | 481 | 447 | 434 |
| 2024 | 355 | |||||||||||
| - = No Data Reported; -- = Not Applicable; NA = Not Available; W = Withheld to avoid disclosure of individual company data. |
| Release Date: 3/29/2024 |
| Next Release Date: 4/30/2024 |