|
Download Data (XLS File) |
|
||||||||
|
||||||||
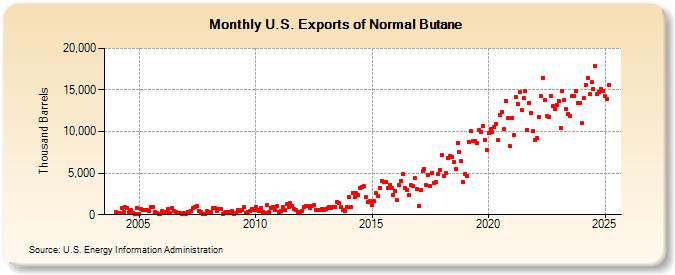
| U.S. Exports of Normal Butane (Thousand Barrels) | ||||||||
| Year | Jan | Feb | Mar | Apr | May | Jun | Jul | Aug | Sep | Oct | Nov | Dec |
|---|---|---|---|---|---|---|---|---|---|---|---|---|
| 2004 | 281 | 191 | 148 | 783 | 320 | 868 | 822 | 382 | 530 | 154 | 121 | 856 |
| 2005 | 135 | 668 | 542 | 614 | 562 | 416 | 958 | 962 | 319 | 242 | 118 | 118 |
| 2006 | 425 | 280 | 302 | 691 | 235 | 752 | 388 | 326 | 215 | 181 | 93 | 217 |
| 2007 | 87 | 327 | 296 | 427 | 861 | 955 | 1,032 | 418 | 359 | 60 | 59 | 428 |
| 2008 | 249 | 329 | 799 | 847 | 424 | 742 | 676 | 133 | 201 | 301 | 315 | 278 |
| 2009 | 397 | 60 | 167 | 556 | 483 | 541 | 908 | 242 | 345 | 457 | 721 | 543 |
| 2010 | 960 | 563 | 410 | 851 | 319 | 192 | 1,165 | 344 | 848 | 873 | 627 | 1,036 |
| 2011 | 351 | 482 | 938 | 606 | 1,278 | 910 | 1,363 | 1,046 | 650 | 574 | 315 | 375 |
| 2012 | 470 | 941 | 1,089 | 1,030 | 797 | 1,022 | 1,114 | 571 | 520 | 542 | 708 | 625 |
| 2013 | 680 | 770 | 977 | 832 | 927 | 987 | 1,488 | 1,356 | 897 | 597 | 496 | 890 |
| 2014 | 2,135 | 888 | 2,617 | 2,076 | 2,596 | 2,396 | 3,194 | 3,370 | 3,393 | 2,120 | 1,469 | 1,649 |
| 2015 | 1,139 | 1,622 | 2,634 | 2,264 | 3,272 | 4,069 | 3,886 | 3,955 | 3,218 | 3,604 | 3,268 | 2,409 |
| 2016 | 2,835 | 1,720 | 3,612 | 4,075 | 4,856 | 3,254 | 3,024 | 2,356 | 3,531 | 3,476 | 4,400 | 3,087 |
| 2017 | 1,084 | 2,931 | 5,249 | 5,488 | 3,519 | 4,801 | 3,428 | 5,032 | 3,861 | 3,876 | 4,913 | 5,387 |
| 2018 | 7,162 | 4,707 | 4,996 | 6,866 | 7,074 | 6,993 | 6,320 | 5,471 | 8,613 | 7,505 | 6,402 | 3,903 |
| 2019 | 4,870 | 4,693 | 8,756 | 10,056 | 8,836 | 8,869 | 8,644 | 10,134 | 9,968 | 10,717 | 8,949 | 7,739 |
| 2020 | 9,869 | 10,290 | 9,901 | 10,573 | 10,959 | 9,043 | 11,991 | 12,333 | 10,274 | 13,647 | 11,593 | 8,226 |
| 2021 | 11,683 | 9,637 | 14,126 | 13,309 | 14,724 | 12,564 | 14,035 | 14,891 | 10,237 | 13,468 | 12,248 | 10,023 |
| 2022 | 8,963 | 9,223 | 11,766 | 14,230 | 16,476 | 13,752 | 11,814 | 11,784 | 14,244 | 13,059 | 12,716 | 13,227 |
| 2023 | 14,481 | 12,702 | 14,682 | 15,445 | 12,664 | 13,383 | 12,567 | 14,865 | 15,643 | 14,905 | 13,412 | 13,446 |
| 2024 | 10,991 | |||||||||||
| - = No Data Reported; -- = Not Applicable; NA = Not Available; W = Withheld to avoid disclosure of individual company data. |
| Release Date: 3/29/2024 |
| Next Release Date: 4/30/2024 |