|
Download Data (XLS File) |
|
||||||||
|
||||||||
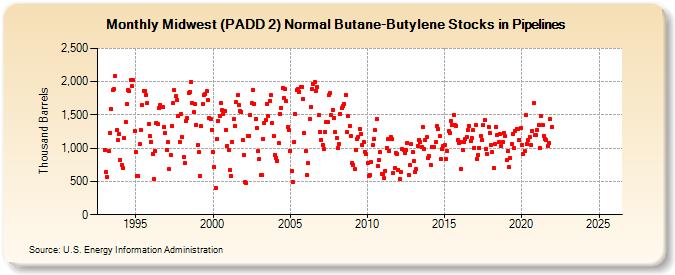
| Midwest (PADD 2) Normal Butane-Butylene Stocks in Pipelines (Thousand Barrels) | ||||||||
| Year | Jan | Feb | Mar | Apr | May | Jun | Jul | Aug | Sep | Oct | Nov | Dec |
|---|---|---|---|---|---|---|---|---|---|---|---|---|
| 1993 | 977 | 644 | 569 | 952 | 1,233 | 1,586 | 1,870 | 1,883 | 2,079 | 1,269 | 1,125 | 1,215 |
| 1994 | 823 | 749 | 697 | 1,148 | 1,399 | 1,662 | 1,878 | 1,858 | 2,020 | 1,928 | 2,018 | 1,259 |
| 1995 | 944 | 584 | 576 | 1,057 | 1,278 | 1,649 | 1,860 | 1,853 | 1,802 | 1,679 | 1,361 | 1,179 |
| 1996 | 1,099 | 915 | 539 | 961 | 1,384 | 1,359 | 1,601 | 1,655 | 1,619 | 1,619 | 1,317 | 1,231 |
| 1997 | 979 | 1,086 | 683 | 904 | 1,335 | 1,677 | 1,871 | 1,777 | 1,731 | 1,485 | 1,100 | 1,517 |
| 1998 | 1,166 | 869 | 774 | 1,416 | 1,452 | 1,834 | 1,849 | 1,995 | 1,686 | 1,537 | 1,661 | 1,355 |
| 1999 | 1,045 | 937 | 583 | 1,326 | 1,661 | 1,795 | 1,812 | 1,854 | 1,719 | 1,454 | 1,436 | 1,280 |
| 2000 | 941 | 712 | 407 | 1,145 | 1,409 | 1,489 | 1,679 | 1,575 | 1,517 | 1,555 | 1,280 | 1,034 |
| 2001 | 972 | 669 | 587 | 1,094 | 1,438 | 1,338 | 1,689 | 1,802 | 1,654 | 1,562 | 1,545 | 1,119 |
| 2002 | 904 | 494 | 475 | 1,184 | 1,185 | 1,497 | 1,675 | 1,876 | 1,671 | 1,437 | 1,304 | 957 |
| 2003 | 835 | 599 | 599 | 1,140 | 1,379 | 1,431 | 1,664 | 1,485 | 1,710 | 1,799 | 1,374 | 1,189 |
| 2004 | 904 | 859 | 806 | 1,071 | 1,521 | 1,608 | 1,908 | 1,756 | 1,884 | 1,704 | 1,322 | 1,269 |
| 2005 | 962 | 664 | 498 | 1,098 | 1,511 | 1,869 | 1,889 | 1,849 | 1,921 | 1,914 | 1,732 | 1,226 |
| 2006 | 959 | 601 | 771 | 1,435 | 1,623 | 1,892 | 1,965 | 1,997 | 1,865 | 1,920 | 1,493 | 1,249 |
| 2007 | 1,130 | 1,053 | 987 | 1,246 | 1,393 | 1,393 | 1,793 | 1,833 | 1,493 | 1,573 | 1,461 | 1,237 |
| 2008 | 1,156 | 999 | 1,066 | 1,519 | 1,597 | 1,634 | 1,671 | 1,802 | 1,236 | 1,482 | 1,335 | 1,189 |
| 2009 | 780 | 754 | 683 | 978 | 1,133 | 1,174 | 1,295 | 1,216 | 1,046 | 1,090 | 947 | 909 |
| 2010 | 772 | 586 | 602 | 785 | 1,049 | 1,142 | 1,267 | 1,438 | 734 | 821 | 937 | 616 |
| 2011 | 610 | 545 | 662 | 1,008 | 1,137 | 963 | 1,172 | 1,140 | 633 | 704 | 934 | 918 |
| 2012 | 676 | 535 | 636 | 990 | 973 | 927 | 966 | 1,083 | 598 | 745 | 1,058 | 940 |
| 2013 | 810 | 648 | 680 | 1,037 | 1,127 | 1,092 | 1,019 | 1,311 | 989 | 1,117 | 1,164 | 859 |
| 2014 | 885 | 751 | 1,022 | 1,023 | 1,014 | 1,088 | 1,337 | 1,288 | 1,179 | 841 | 981 | 1,039 |
| 2015 | 1,050 | 841 | 965 | 1,257 | 1,234 | 1,407 | 1,352 | 1,505 | 1,350 | 1,337 | 1,120 | 1,082 |
| 2016 | 1,096 | 687 | 979 | 1,086 | 1,136 | 1,162 | 1,272 | 1,336 | 1,104 | 1,159 | 1,270 | 1,004 |
| 2017 | 1,345 | 843 | 894 | 1,003 | 1,189 | 1,122 | 1,345 | 1,420 | 985 | 913 | 1,325 | 1,232 |
| 2018 | 1,047 | 940 | 704 | 1,064 | 1,318 | 1,197 | 1,086 | 1,214 | 1,035 | 1,100 | 1,233 | 1,179 |
| 2019 | 821 | 951 | 713 | 857 | 1,070 | 1,214 | 997 | 1,264 | 1,292 | 1,295 | 1,129 | 1,303 |
| 2020 | 1,055 | 906 | 963 | 1,498 | 1,070 | 1,118 | 1,169 | 1,052 | 1,265 | 1,677 | 1,191 | 1,200 |
| 2021 | 1,280 | 1,351 | 1,005 | 1,486 | 1,349 | 1,184 | 1,141 | 1,122 | 1,037 | 1,076 | 1,432 | 1,324 |
| 2022 | -- | -- | -- | -- | -- | -- | -- | -- | -- | -- | -- | -- |
| 2023 | -- | -- | -- | -- | -- | -- | -- | -- | -- | -- | -- | -- |
| 2024 | -- | |||||||||||
| - = No Data Reported; -- = Not Applicable; NA = Not Available; W = Withheld to avoid disclosure of individual company data. |
| Release Date: 3/29/2024 |
| Next Release Date: 4/30/2024 |