|
Download Data (XLS File) |
|
||||||||
|
||||||||
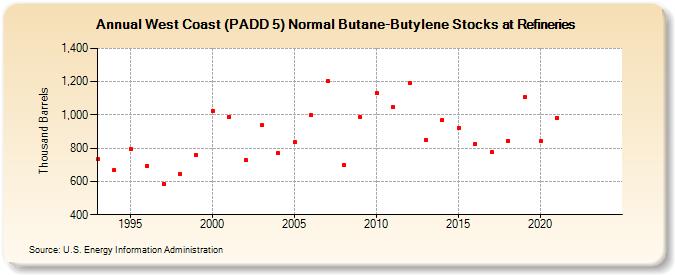
| West Coast (PADD 5) Normal Butane-Butylene Stocks at Refineries (Thousand Barrels) | ||||||||
| Decade | Year-0 | Year-1 | Year-2 | Year-3 | Year-4 | Year-5 | Year-6 | Year-7 | Year-8 | Year-9 |
|---|---|---|---|---|---|---|---|---|---|---|
| 1990's | 733 | 669 | 795 | 693 | 585 | 644 | 761 | |||
| 2000's | 1,025 | 988 | 729 | 937 | 771 | 837 | 998 | 1,205 | 697 | 988 |
| 2010's | 1,131 | 1,045 | 1,191 | 852 | 970 | 924 | 826 | 775 | 845 | 1,106 |
| 2020's | 844 | 982 | -- | -- |
| - = No Data Reported; -- = Not Applicable; NA = Not Available; W = Withheld to avoid disclosure of individual company data. |
| Release Date: 8/30/2024 |
| Next Release Date: 8/29/2025 |