|
Download Data (XLS File) |
|
||||||||
|
||||||||
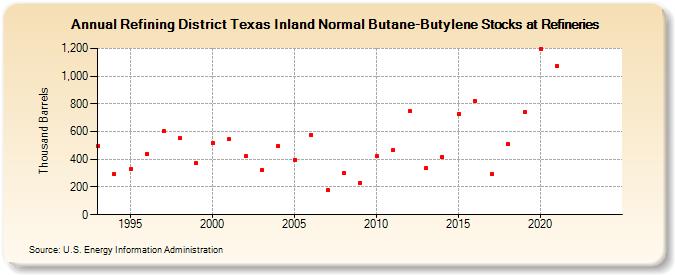
| Refining District Texas Inland Normal Butane-Butylene Stocks at Refineries (Thousand Barrels) | ||||||||
| Decade | Year-0 | Year-1 | Year-2 | Year-3 | Year-4 | Year-5 | Year-6 | Year-7 | Year-8 | Year-9 |
|---|---|---|---|---|---|---|---|---|---|---|
| 1990's | 495 | 293 | 328 | 440 | 601 | 551 | 372 | |||
| 2000's | 514 | 544 | 421 | 326 | 494 | 398 | 576 | 177 | 301 | 229 |
| 2010's | 422 | 466 | 745 | 336 | 415 | 729 | 820 | 293 | 510 | 740 |
| 2020's | 1,196 | 1,071 | -- | -- |
| - = No Data Reported; -- = Not Applicable; NA = Not Available; W = Withheld to avoid disclosure of individual company data. |
| Release Date: 6/28/2024 |
| Next Release Date: 8/30/2024 |
Referring Pages: